
The Upcoming 21st Century Stagflationary Depression, Part 8
The Upcoming 21st Century Stagflationary Depression, Part 8
Part 8: Energy

Energy, and oil in particular, is often called the lifeblood of the economy. Without it we cannot utilize modern travel vehicles, power manufacturing plants, keep our homes warm or cool, harvest large scale crops, refrigerate and cook the food that we eat, keep the internet and computer servers running, the list goes on and on! Natural gas is used to make nitrogen based fertilizers. Oil also is used in many products such as plastics, insulation, textiles, medical supplies, and cosmetics to name a few in a very long list of items we use every day. Energy markets are a big deal to the health of the global economy! We are all getting a front row seat to the pain caused by higher energy prices as they wreak havoc in Europe.

What will happen during the upcoming stagflationary depression to the energy sector? Will oil prices rise so high that we see 1970s style gas lines everywhere? Or will the deflationary effects resulting from an economic slow down keep prices contained? We can guess as much as we want but I’d rather look at some charts wouldn’t you?
Energy
According to Bloomberg, energy costs are set to reach a record of 13% of global GDP.1 The energy sector includes multiple energy sources as shown below.
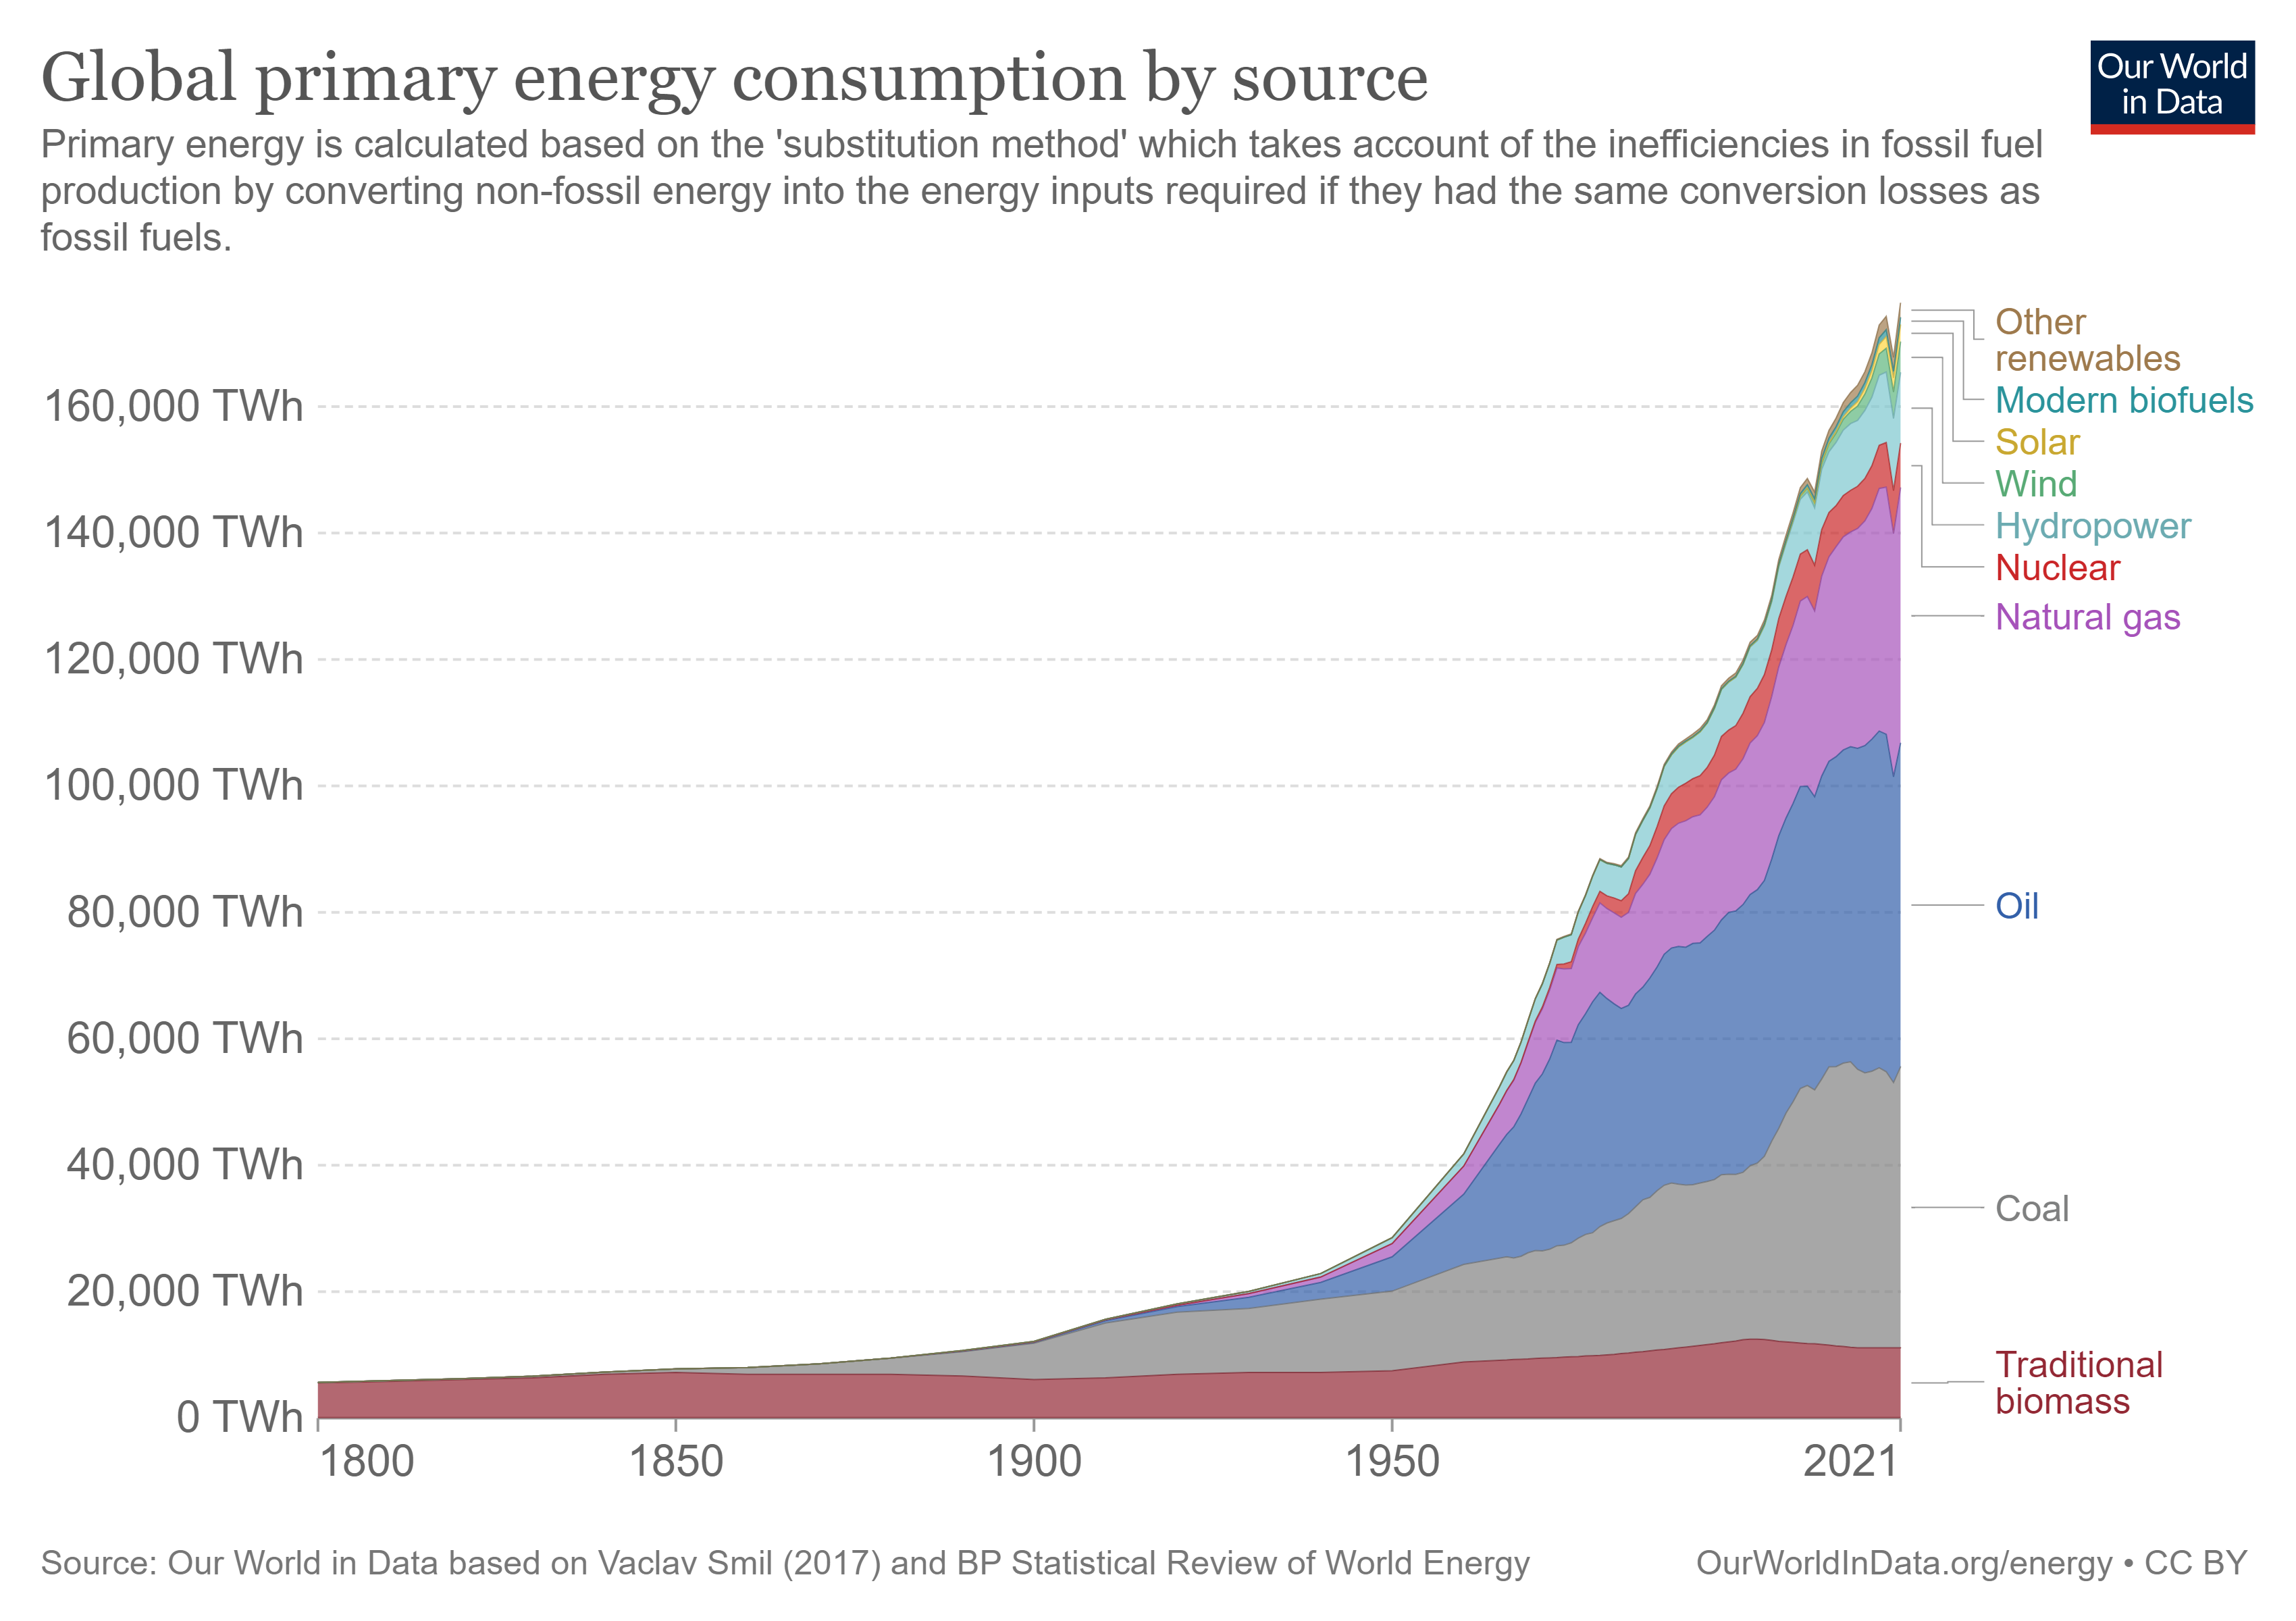
We’ll concentrate on the largest sources of energy related commodities for this report and select a few companies and ETFs (exchange traded funds) that can help provide additional clarity. Although smaller in size, I also included the nuclear energy sector since my son is as interested in becoming a nuclear engineer as I am interested to find out if the #UraniumSqueeze will be the real deal. Lets start with oil first.
Oil
Oil is sometimes referred to as Black Gold or Texas Tea and the world consumes over 35 billion barrels of it per year. I find the long term chart for oil fascinating. It clearly has started a new Grand Supercycle (G.C.) wave III after a 14 year correction that culminated in a futures pricing close of negative $37.63/barrel on Monday April 20, 2020.2 Note that I’m basing the long term channel’s lower rail off the monthly close so the negative closing price is ignored in this chart. In engineering/scientific analysis, one throws out anomalous data points which I am doing here. Without leveraged futures contracts, I believe price would have never gone negative. Seriously, in April 2020, how would you react if someone told you they would pay you $37 to take a barrel of oil off their hands (provided you had a means to store it)? You would turn down $37 cash? I doubt it. If the price anomaly is not ignored, then the count resets which is also bullish as its a wave 1.

I must say this is the biggest 1-2, 1-2 setup I have ever seen since the oil price made 5 intermediate waves up from the April 2020 low. Looking closer it appears to be bottoming to complete Intermediate wave (2). Hence waves 1-2 are complete on the G.C. degree and 1-2 in the Intermediate degree as well. Remember that wave 3s tend to be the longest and strongest waves of all. This will be quite the run and confirms inflationary forces are ahead as oil will be trending much higher this next decade and potentially beyond.

ExxonMobil, XOM
XOM is one of the world's largest publicly traded international oil and gas companies currently valued at $413 billion. It is the largest United States-based oil and gas producing company and as of June 2022, its revenues amounted to nearly $307 billion. Looking at the chart it completed 5 waves up in the Primary degree for its first Cycle which topped in 2008. It then completed a 12 year long ABC correction for Cycle II and has now started its third Cycle and is making 5 waves up in the Minor degree. A breakout to new all time highs will be extremely bullish for the energy sector and portends higher oil and natural gas prices moving forward.

Natural Gas
Natural gas broke out of 14 year bullish ending diagonal (or falling wedge) and has made 5 waves up in the Minor degree to complete an Intermediate wave (1). I see price consolidating here in wave (2) which could even provide a second backtest of the breakout near the 0.618 Fib retrace but then once again we should see much higher prices going forward as Primary wave 3 fills out.

Coal
I was planning to use the VanEck Vectors Coal ETF (KOL) for this analysis but learned the fund was closed in January 2021 (which is interesting in of itself as the coal price went on a tear soon thereafter). Instead we’ll rely on the Newcastle Coal Futures contract which is cash settled against the globalCOAL Monthly NEWC Index. The NEWC Index is the benchmark price for seaborne thermal coal in the Asia-Pacific region. Similar to XOM, coal is building out 5 impulsive waves in the Intermediate degree. If it holds Intermediate (2) in corrective fashion (3 waves down) then targets for wave (3) will be much higher than todays current price. We can add Fibonacci extension targets once the low for (2) is in place. Coal still needs to finish intermediate (1) first. We will need to adjust Fib price targets after (2) is completed. Zoolander’s dad Larry should be proud of coal’s comeback.

Peabody Energy, BTU
BTU is the largest coal mining company in the U.S. with a revenue of $22.77 billion. It emerged from bankruptcy in 2017. Share price reached a low in November 2020 at which point the Elliott Wave count reset. BTU made five waves up in the Minor degree and is now in the process of correcting in an Intermediate wave (2). I’ve placed some Fib levels where price may find support. Just as we saw in the coal future’s chart, BTU is also in a bullish posture both near term and potentially longer term provided the intermediate 5 wave structure fills out. To much chagrin of the the climate change / “green” energy advocates, coal will continue to play a major role in global energy markets.

Uranium
Let’s turn our attention to the nuclear energy sector. Around 10% of the world's electricity is generated by about 440 nuclear power reactors. About 55 more reactors are under construction in 15 countries, equivalent to approximately 15% of existing capacity.3 Its a growing sector and given much higher costs for oil, gas, and coal, I believe its wise to take a close look at it.
Sprott Uranium Physical Trust, U.UN
The Uranium UX continuous U3O8 , or “yellowcake” current contract front month has data in TradingView only going back to 2008 so for this analysis I will use the Sprott Uranium Physical Trust U.UN which includes data from 2006 to build a more complete picture. Long term Uranium investors will likely smile at the arcs shown which may turn out to be a multi-decade cup formation. Is this going to be a cup and handle?! Five impulsive waves in the minor degree have been completed off the 2020 low to complete its first intermediate degree cycle. It may have already started Intermediate (3) but can also correct further to complete wave (2) first so investors must prepare for that event.

Global X Uranium ETF, URA
The URA Exchange Traded Fund should give us additional insight on the sector as it includes 46 holdings of companies in the nuclear energy sector. Again we see 5 waves up in the Minor degree with higher prices ahead in the Intermediate structure. At this time I am still on the fence as to whether the corrective wave (2) is complete. My alternate count for a zig-zag triple combo for a lower (2) is shown if price heads lower first.

Summary and Observations
Energy costs are going higher, period, the end. This is highly stagflationary and the economy will struggle through the process of higher prices / input costs as energy related industries seek out and invest in new energy sources and commodity reserves. Like anything else it won’t be a straight line up and one can surely expect violent corrections along the way. However these corrections will be buying opportunities for those with patience and a longer term view. I’m happy my son remains interested in becoming a nuclear engineer one day instead of a banker or real estate agent. Long live the #UraniumSqueeze and the larger #EnergySqueeze.
Scorecard:
Energy is clearly bullish near and longer term, at least in my Elliott Wave analysis:

I would like to note (and as I recently mentioned on my Twitter feed, that there is a possibility that the multi-generational top has already been seen in the equity market indices. Wave counts are getting very overstretched and we might have seen a truncated Primary Wave 5 of V of Supercycle (III). Remember Elliott Wave is both subjective and probabilistic and one has to adjust to the price action accordingly. I’m now looking over many stocks we’ve reviewed in these Substack reports here and triple checking the wave counts. We know Real Estate and many European banks have already topped but its a mixed bag for technology, manufacturing, and retail. I can see certain alternate counts in some sectors/stocks that may have already put in a high but they will still have at least a strong bounce at the minimum before their much larger degree corrections begin in earnest. Topping is a process that will take time, especially at this degree level and with alternation in play. We’ll let price tell us what’s ahead.
Stay tuned for Part 9 where we will cover commodities in the base metal and agricultural segments. Will food costs and the raw materials used to build industry keep rising?
Until then…
Cheers and #EndTheFed
-Hypersonic78
Also please be advised nothing here or in any other part of this Substack series is financial advice. Views are my own. Do your own diligence. Learn Elliott Wave and other analysis techniques you believe in and form your own world view before risking any capital you cannot part with. I will never stop learning from others and hope you won’t either. Please help others, especially during the hard times I believe are ahead.
https://www.bloomberg.com/news/articles/2022-03-16/energy-costs-set-to-reach-record-13-of-global-gdp-this-year
https://www.nytimes.com/2020/04/20/business/oil-prices.html
https://world-nuclear.org/information-library/current-and-future-generation/nuclear-power-in-the-world-today.aspx
I've learnt more in this one post, than anything else online. Thank you so much.
I'll be following you probably forever! Cheers.
So if oil goes to $225 a barrel by 2025 that will be terrible for stocks and the economy...yet a number of your charts indicate that the SPX will melt up/ATH in the next 2 years.
How do you explain that disconnect?