
The Upcoming 21st Century Stagflationary Depression, Part 9.1
The Upcoming 21st Century Stagflationary Depression, Part 9.1
Part 9.1: Commodities; Agricultural Soft Commodities

Commodities are typically resources that have full or substantial fungibility. This means that the market treats instances of the resource as equivalent or nearly so with no regard to who or where they were produced. For example a bushel of wheat grown in Iowa is considered the same as a bushel of wheat grown in Alberta. There are three types of commodities: 1) Energy related commodities like oil and natural gas 2) “soft” commodities which include agricultural products like sugar, or grains like rice and wheat, and 3) “hard” commodities like iron ore, aluminum, nickel, and other mined resources.
We covered several energy commodities in Part 8 but there are many charts I would like to share for hard and soft commodities so we’ll need to split this report up into two parts. For this report we’ll cover soft commodities and then we’ll cover the “hard” stuff in Part 9.2.
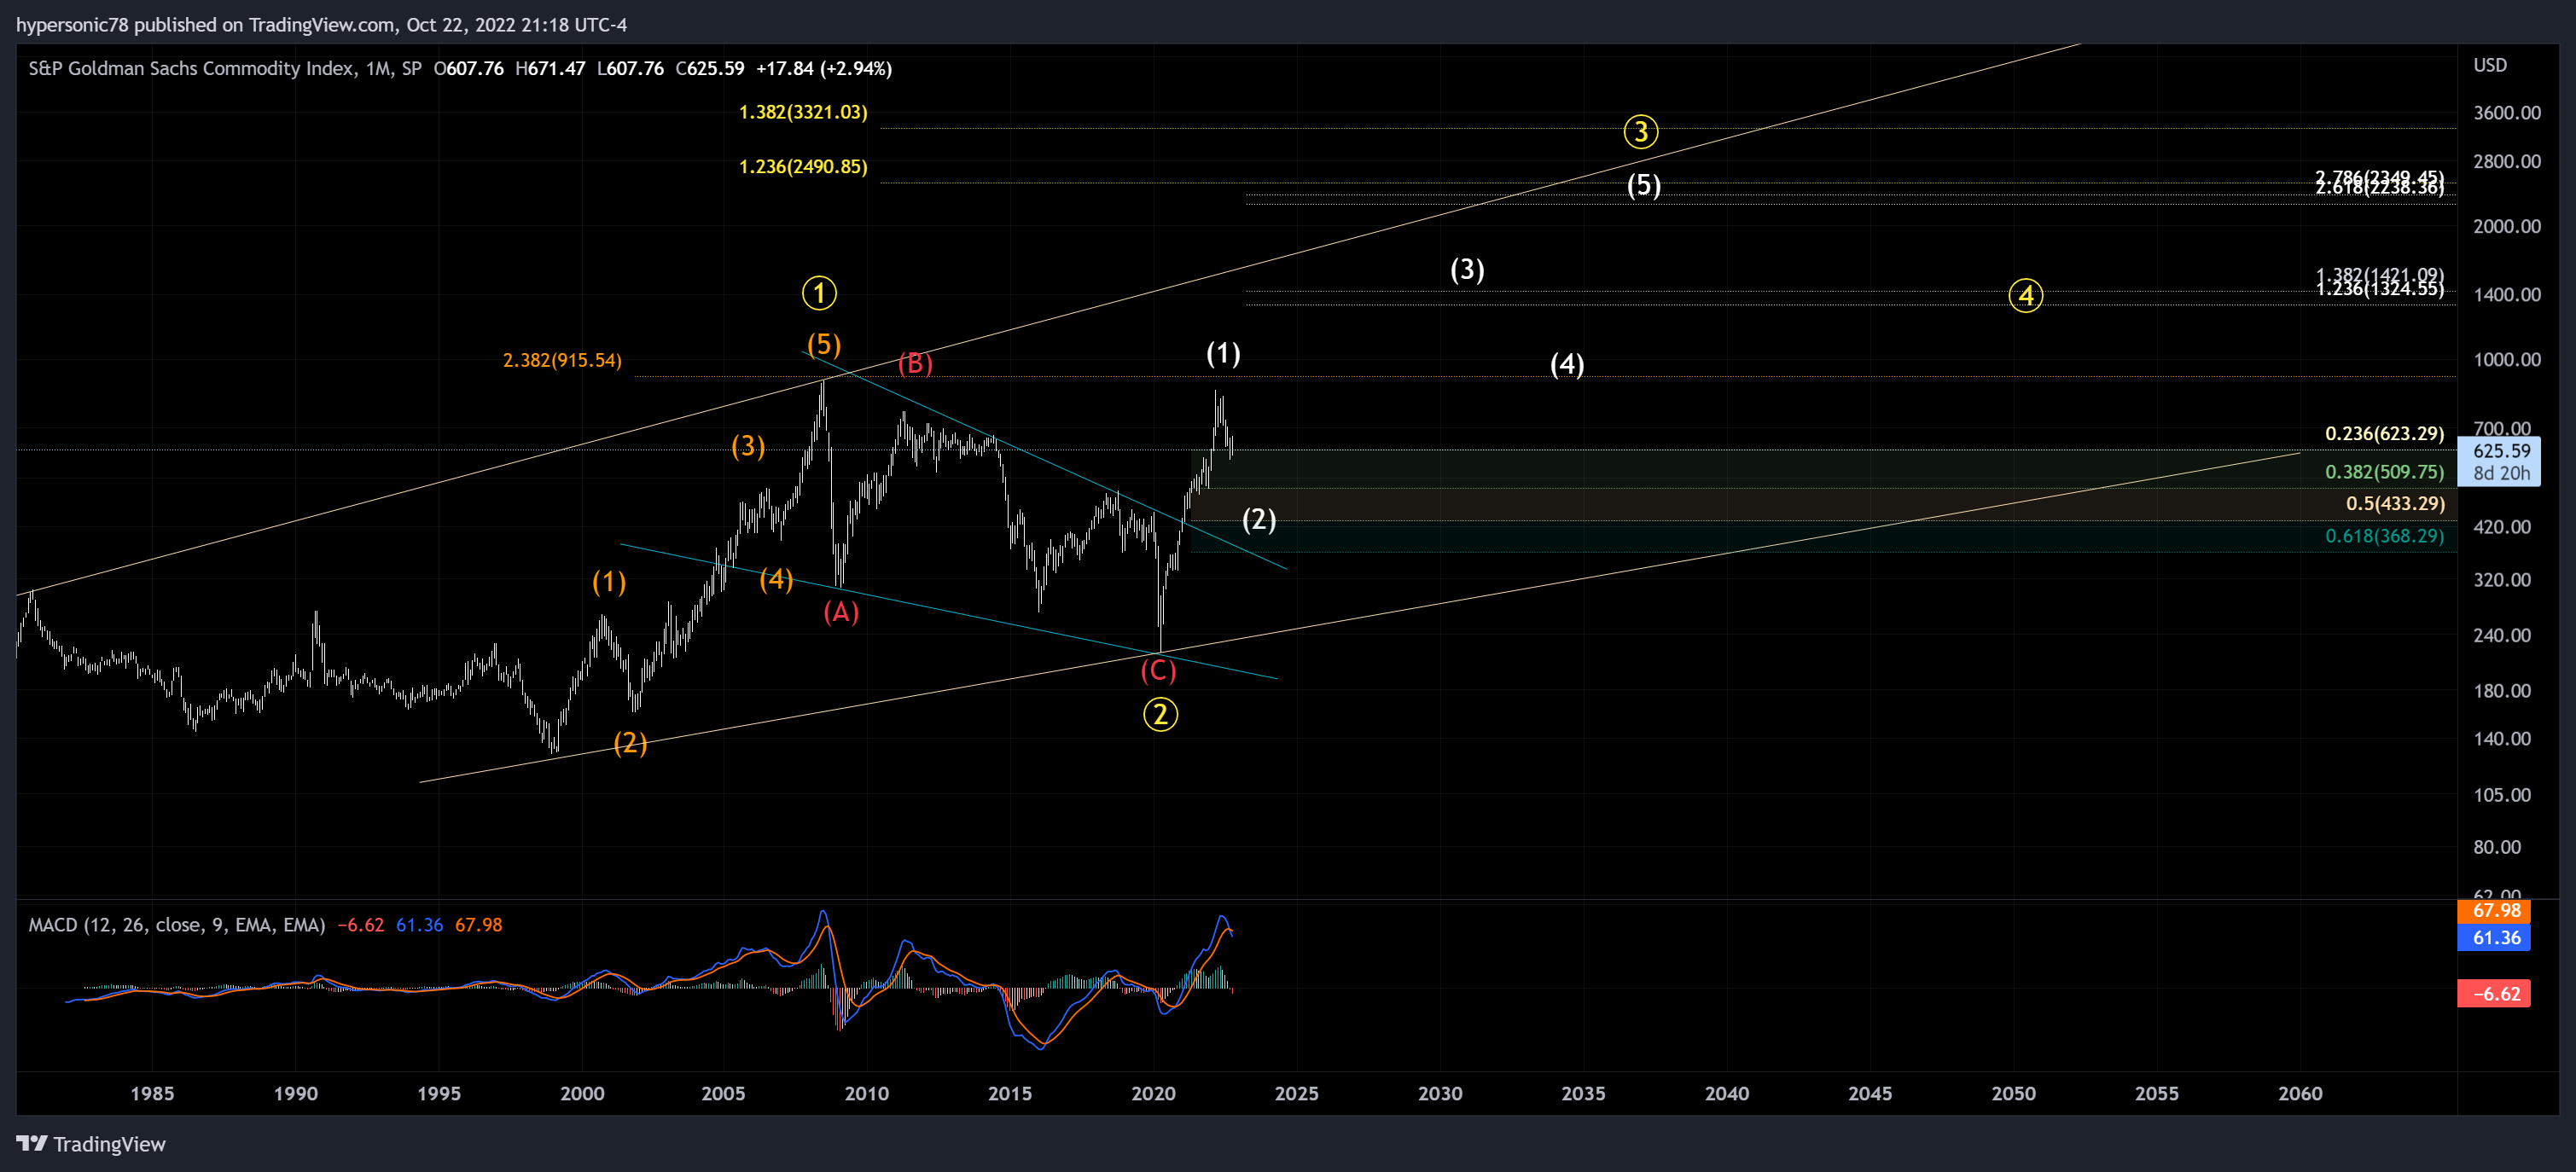
What will happen to the prices of soft commodities during a stagflationary depression? After the observations we made in Part 8, my best guess would be that soft commodities will likely rise in price due to higher costs of fuel and fertilizer. before we start looking at individual commodity charts lets take a look at this index which may give us a hint. The S&P Goldman Sachs Commodity Index serves as a benchmark for investment in the commodity markets and as a measure of commodity performance over time. The index comprises 24 commodities from all sectors - energy products, industrial metals, agricultural products, livestock products and precious metals. Here we see it completed Primary wave 1 in 2008 before a 12 year Primary wave 2 correction. It also had 5 waves up from the April 2020 low to complete Intermediate (1) and is now pulling back in an Intermediate wave (2). I placed some notional Fibonacci extensions where the rest of the intermediate wave structure may result from the 50% level but we’ll see how far it corrects here and adjust accordingly.
Now let’s get into some individual soft commodity charts and see if we can add supporting evidence of the bullish structure we’re seeing in the index. Will be selective and choose the largest food staples as well as a few others.
Wheat
We’ll begin our study with wheat. This channel jumped out at me like a couple slices of bread popping out of a toaster. I also see a completed cup formation between the 2008 and 2022 highs. Minor wave 4 of Intermediate (3) would then likely be the handle if the price action remains corrective from 3. We’ll see. Prices for wheat are pulling back here but as Primary 3 fills out the general price trend is clearly trending higher.

Soybeans
Soybeans are a major worldwide crop. According to a recent study1, more than three-quarters (77%) of global soy is fed to livestock for meat and dairy production. Most of the rest is used for biofuels, industry or vegetable oils. Just 7% is used directly for human food products such as tofu, soy milk, edamame beans, and tempeh. Soybean futures broke out from a declining trend in 2008 and is now appears to be in the heart of a longer term Cycle III. Like wheat its pulling back here in an Intermediate wave (2) of Primary 3 but the general longer term trend remains clearly to the upside.

Corn
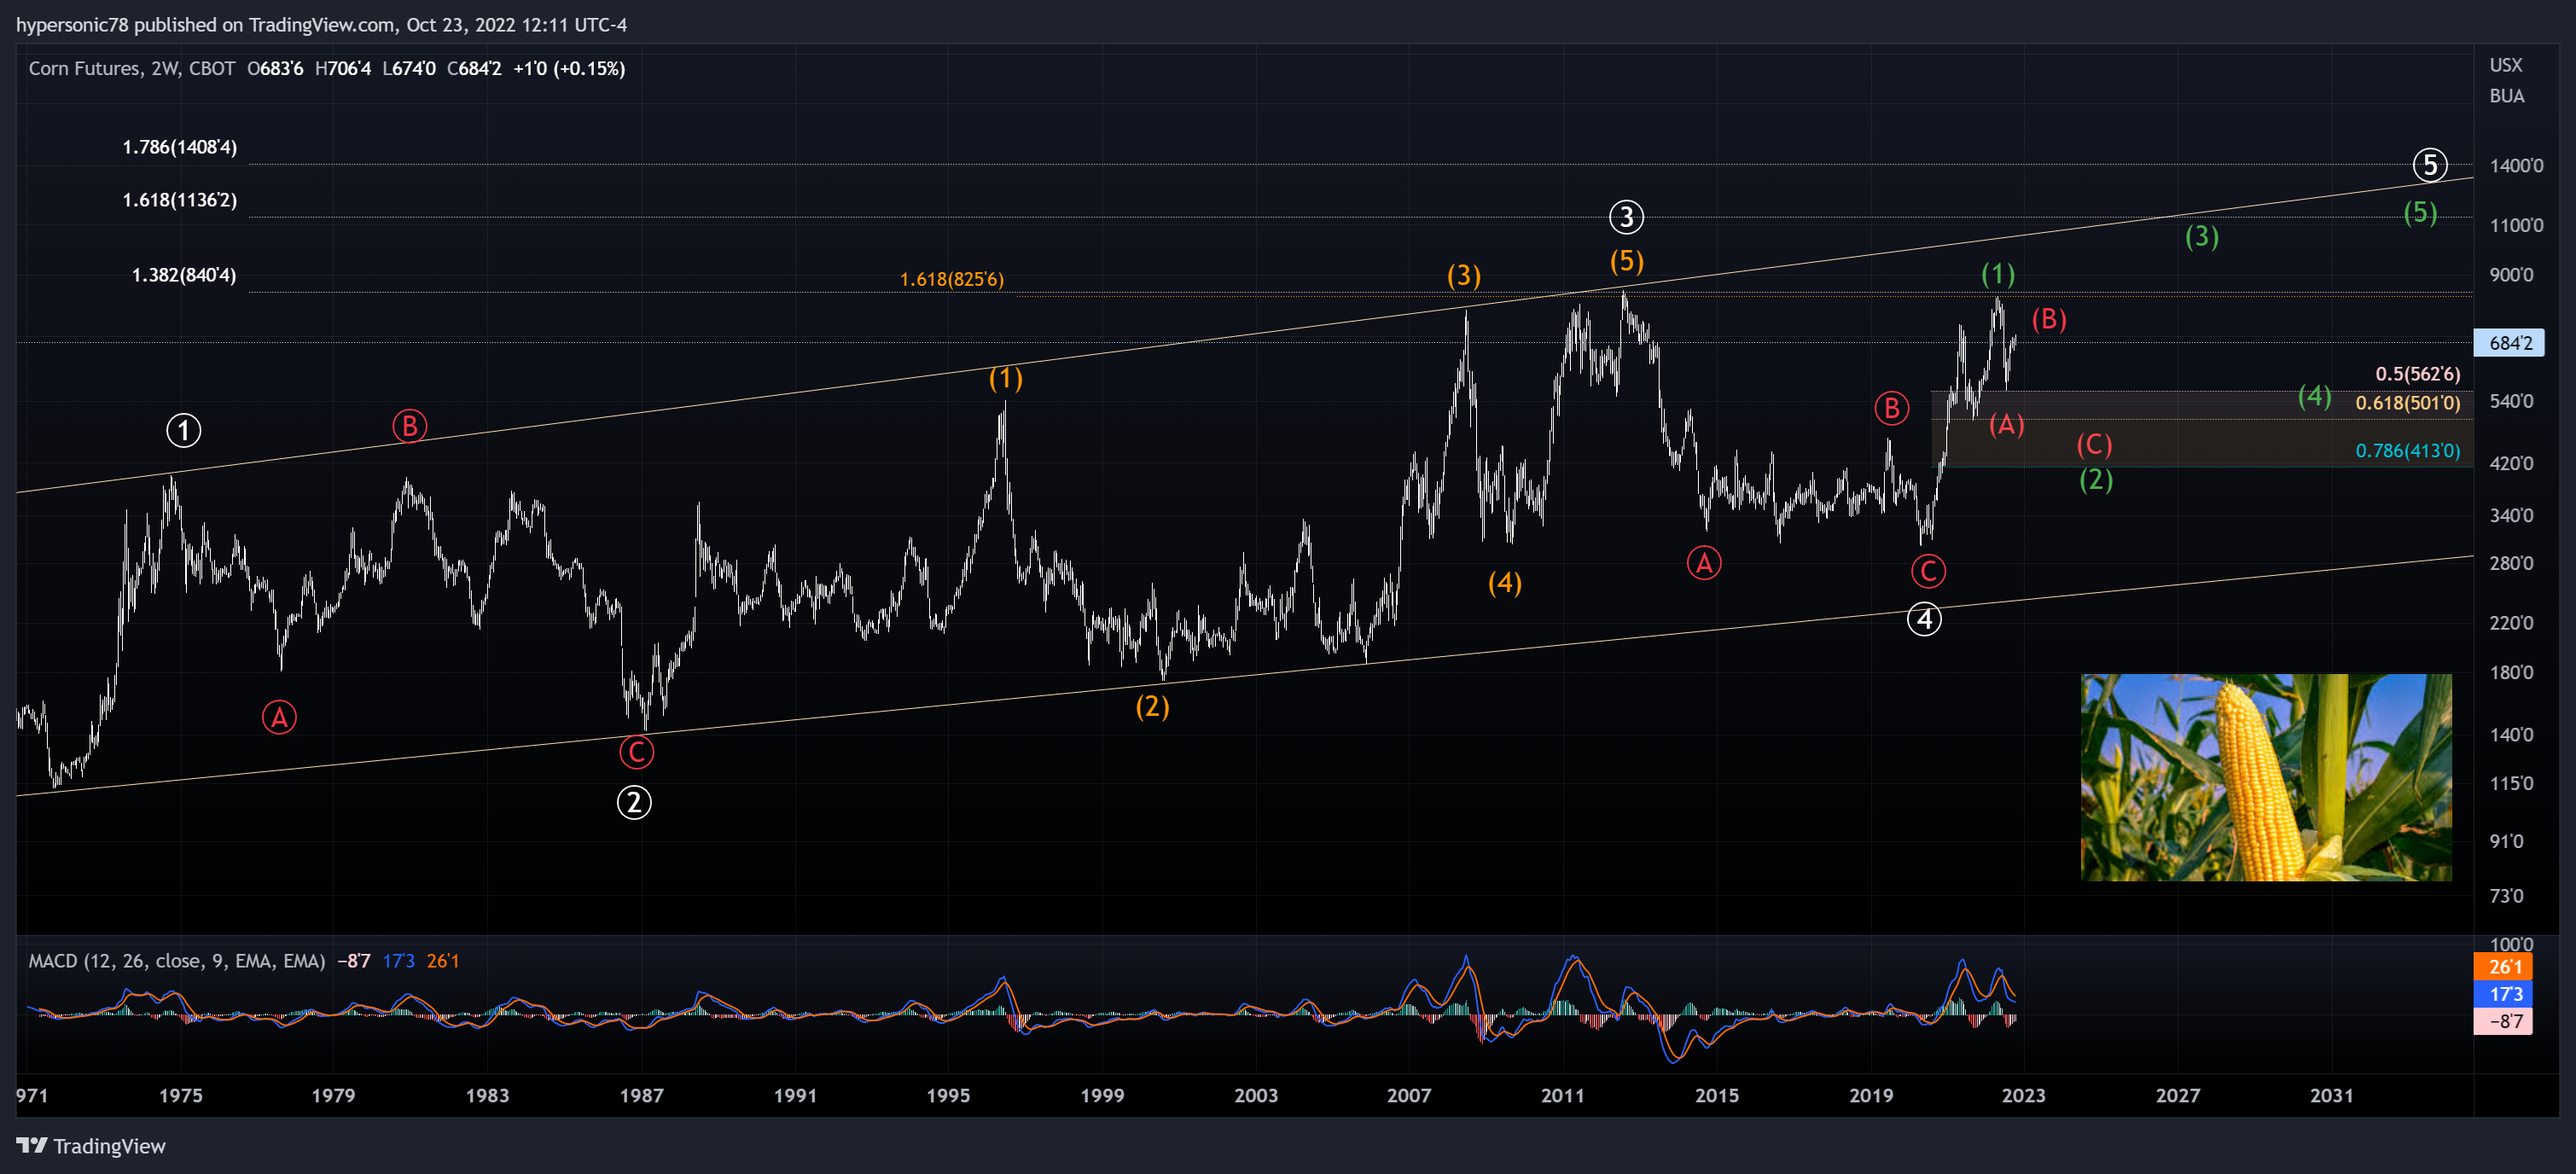
Corn is also in an major long term uptrending channel. It corrected into what I’m counting at Primary wave 4 after 8 year consolidation then made five waves up to complete Intermediate (1). Like wheat and soybeans, it is also correcting in an Intermediate (2) with higher prices going forward after the consolidation is complete. Worth noting is the extensive overlap that was seen in Primary 3 so one should not be surprised to see the same type of volatility during the rest of Primary 5.
Sugar
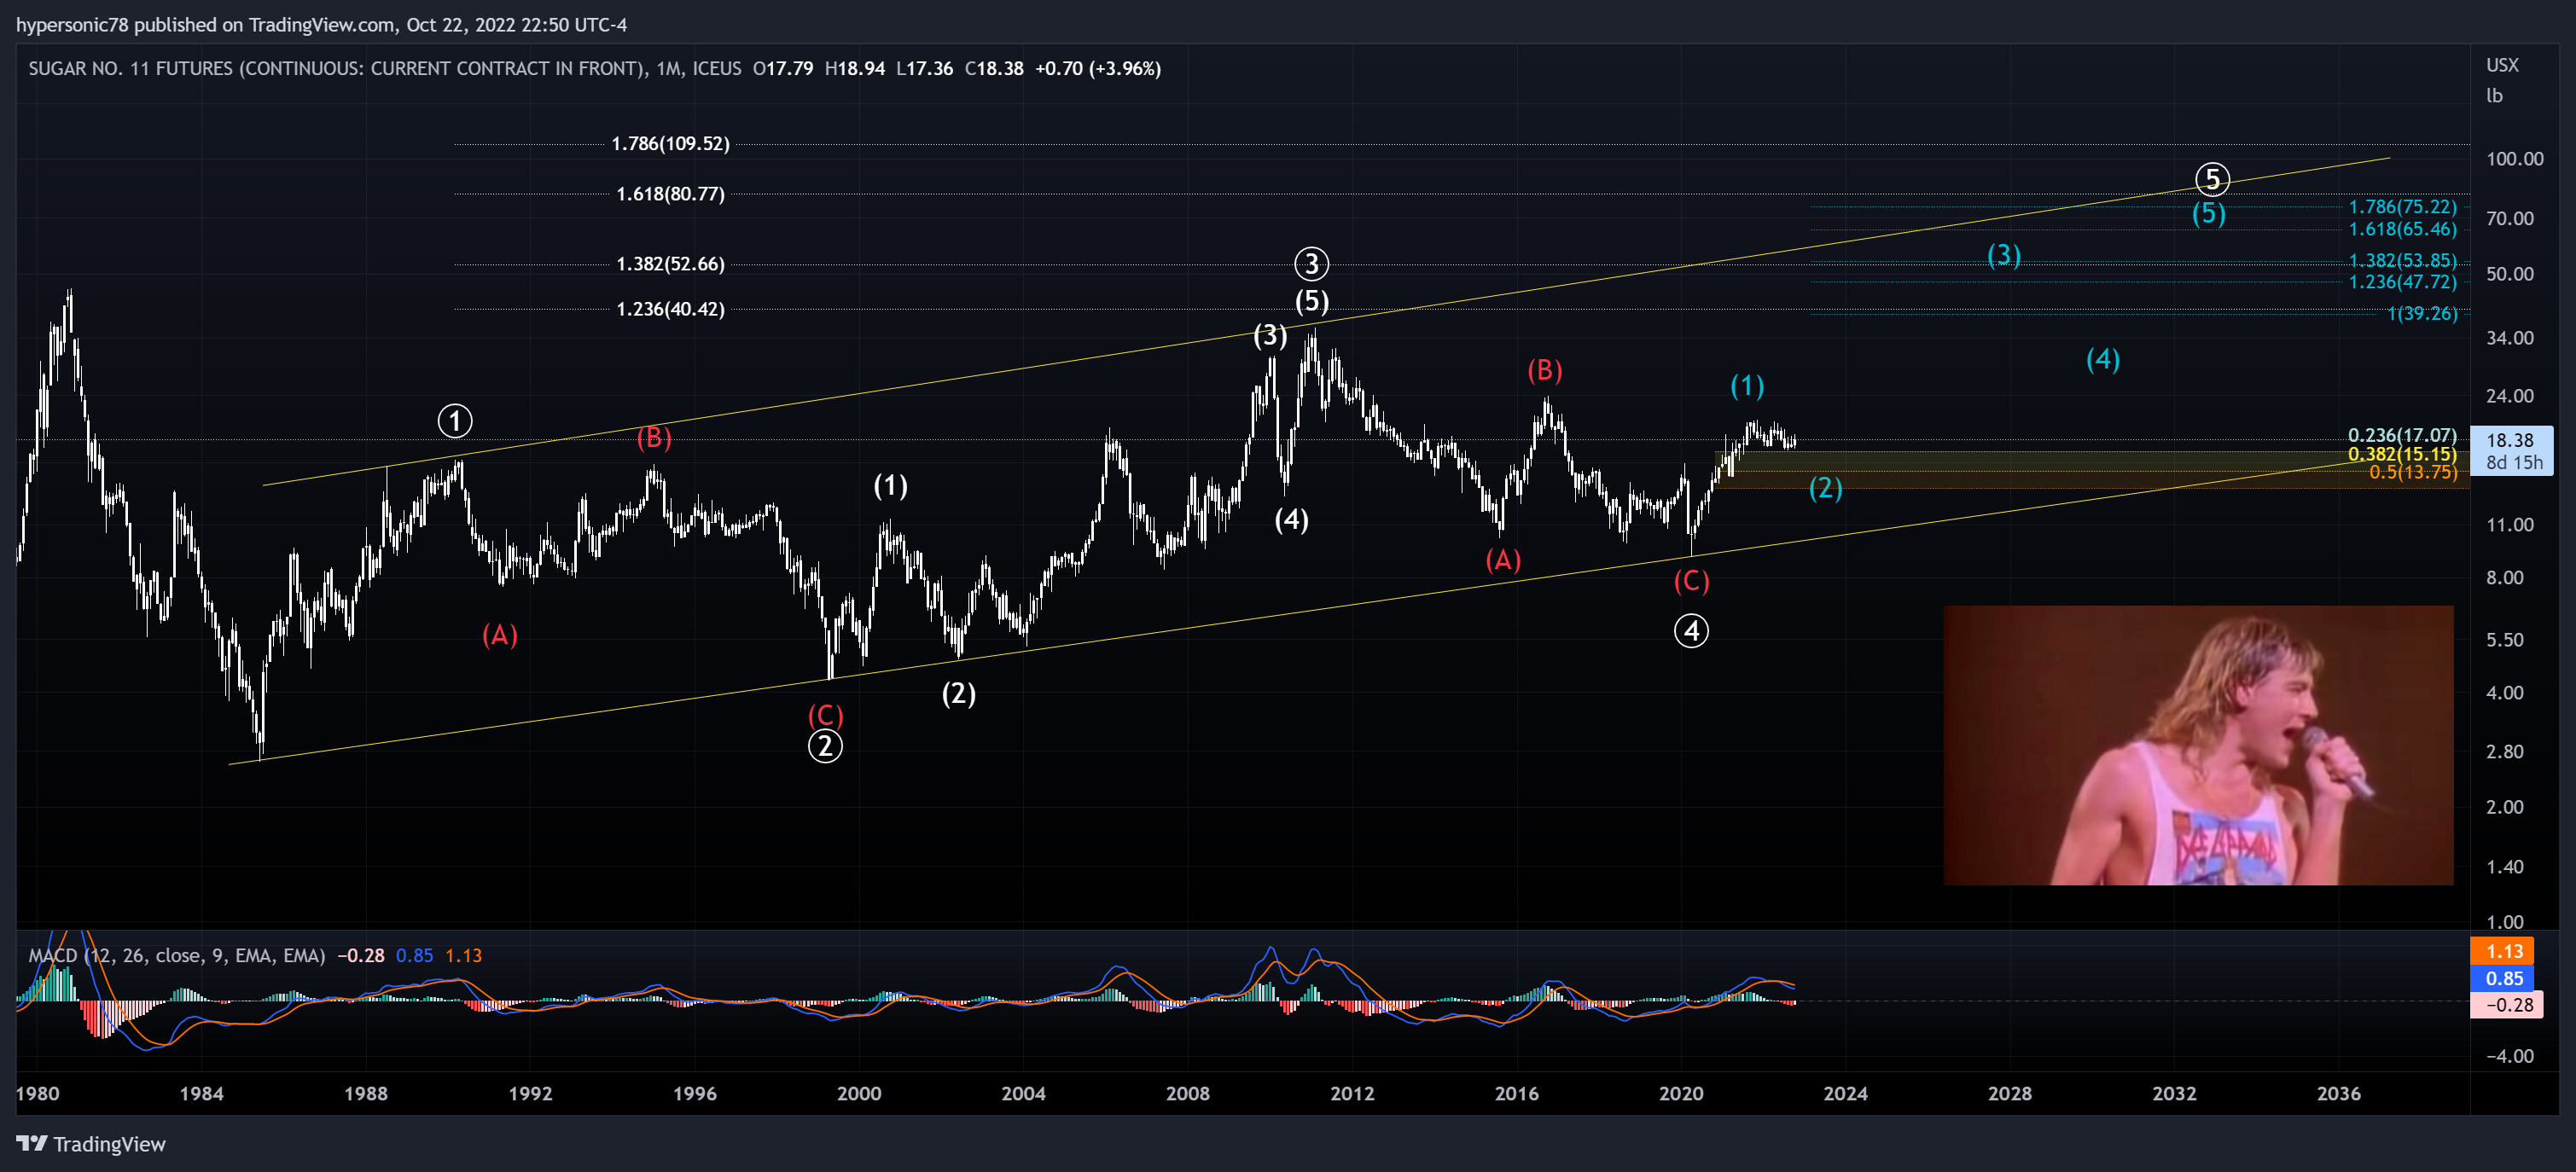
Def Leppard was one of my all time favorite bands growing up. Sugar looks pretty sweet here with a Intermediate (1)-(2) setup after a similar Primary 4 consolidation that presented in the Corn chart. Fibonacci extensions for both the Primary and Intermediate degrees also seem to line up well with the present rising channel. “Sometime, anytime, sugar me sweet…”
Coffee
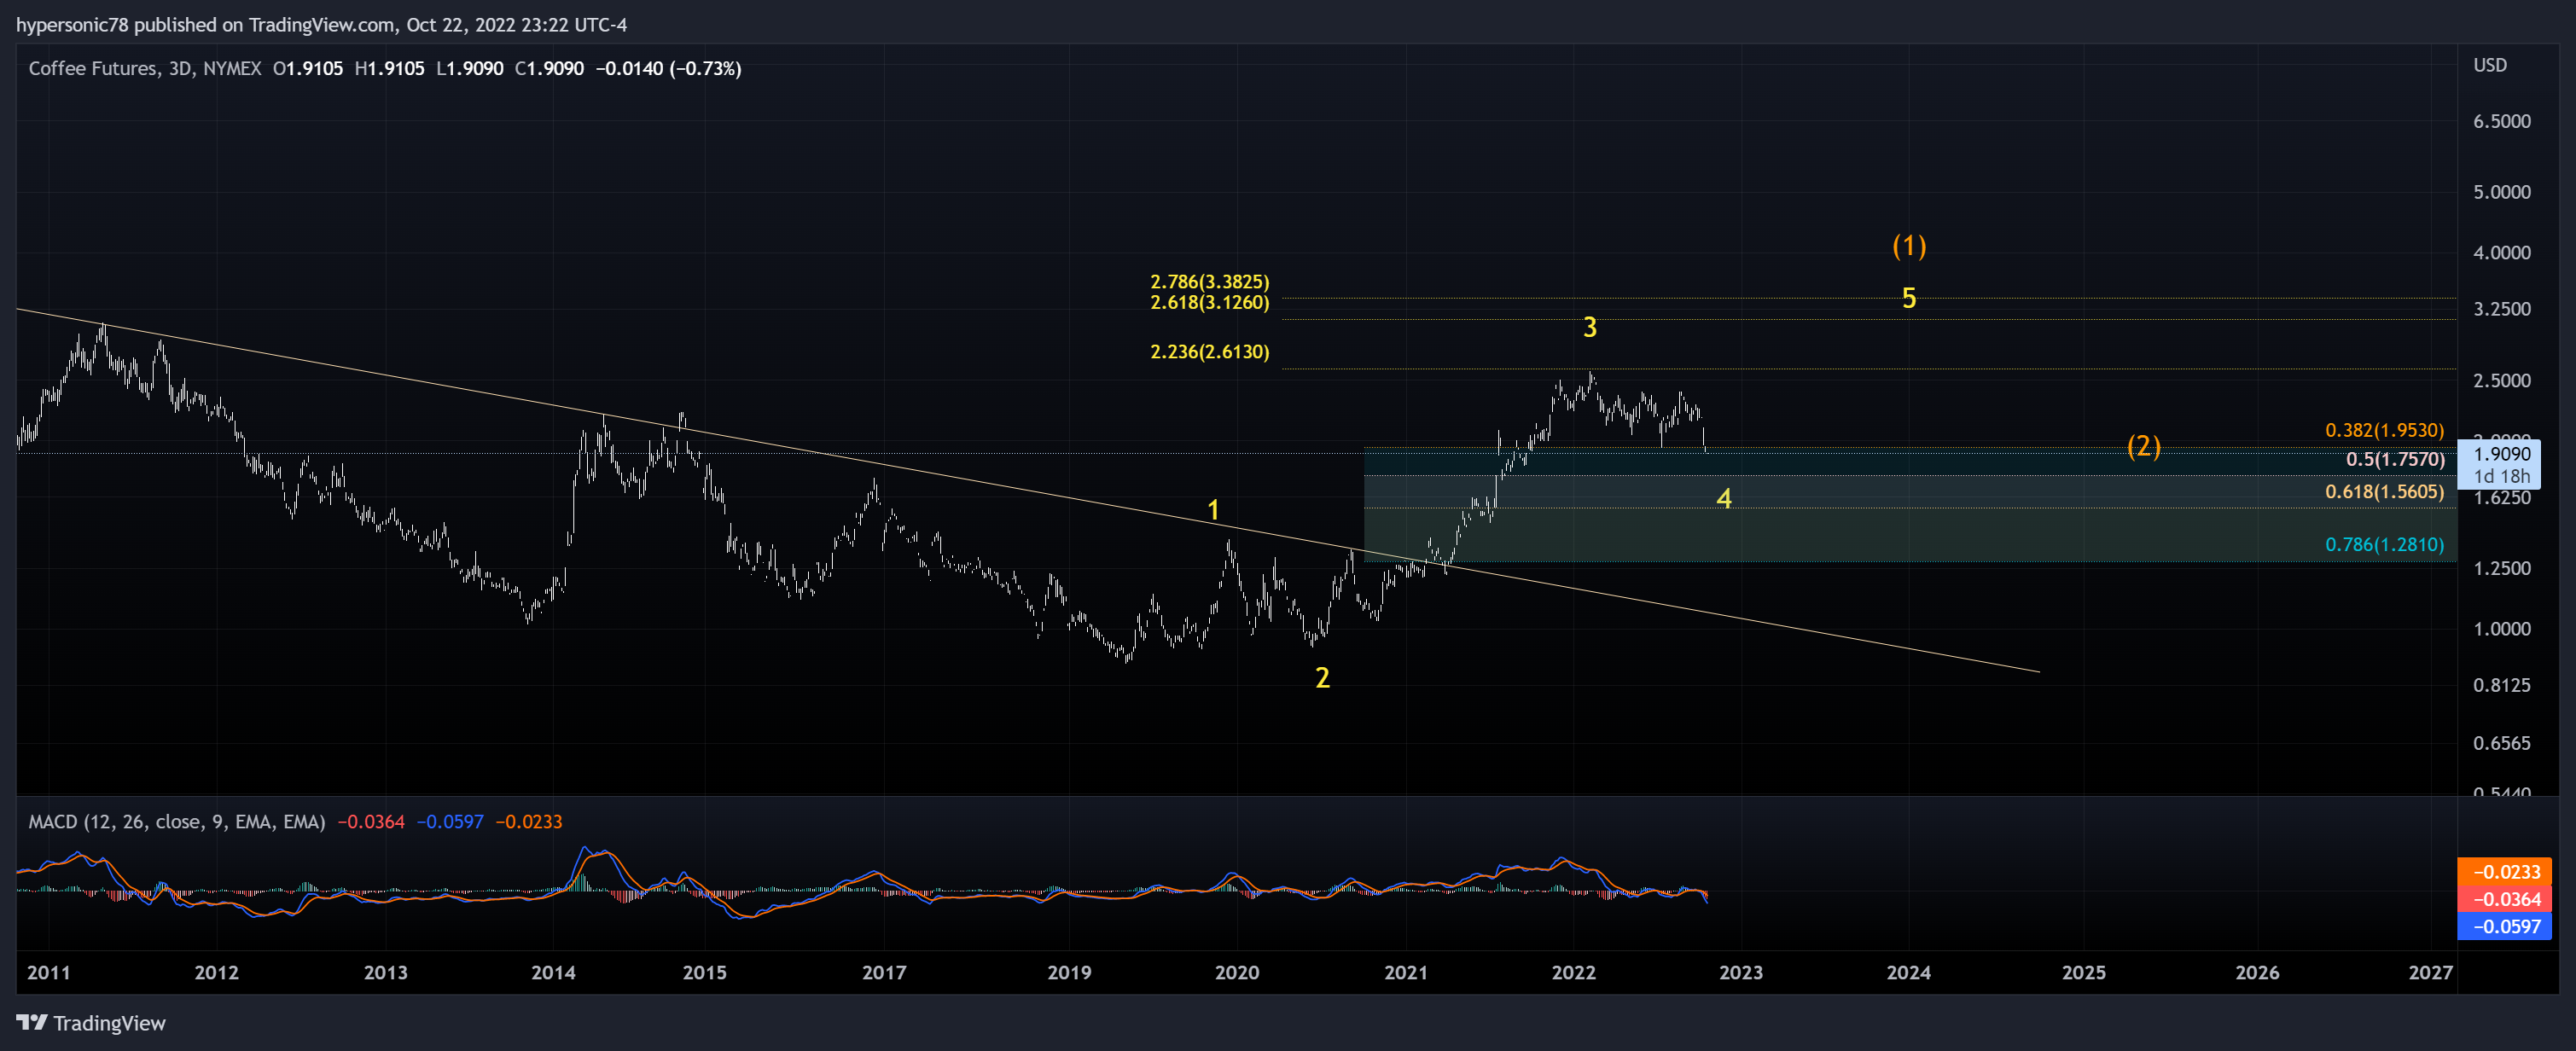
The continuous KT coffee futures chart doesn’t have a a long history in TradingView. A clear decade long downtrend was broken and so far an impulsive five wave structure in the Minor degree appears to be filling out here. One could expect longer term higher coffee prices based on a completion of an impulsive five wave structure to complete Intermediate (1) followed by a corrective consolidation Wave (2). Definitely worth watching. Remember in Part 4, we found a quite bearish long term Elliott Wave structure forming in the Starbucks chart. Very interesting.
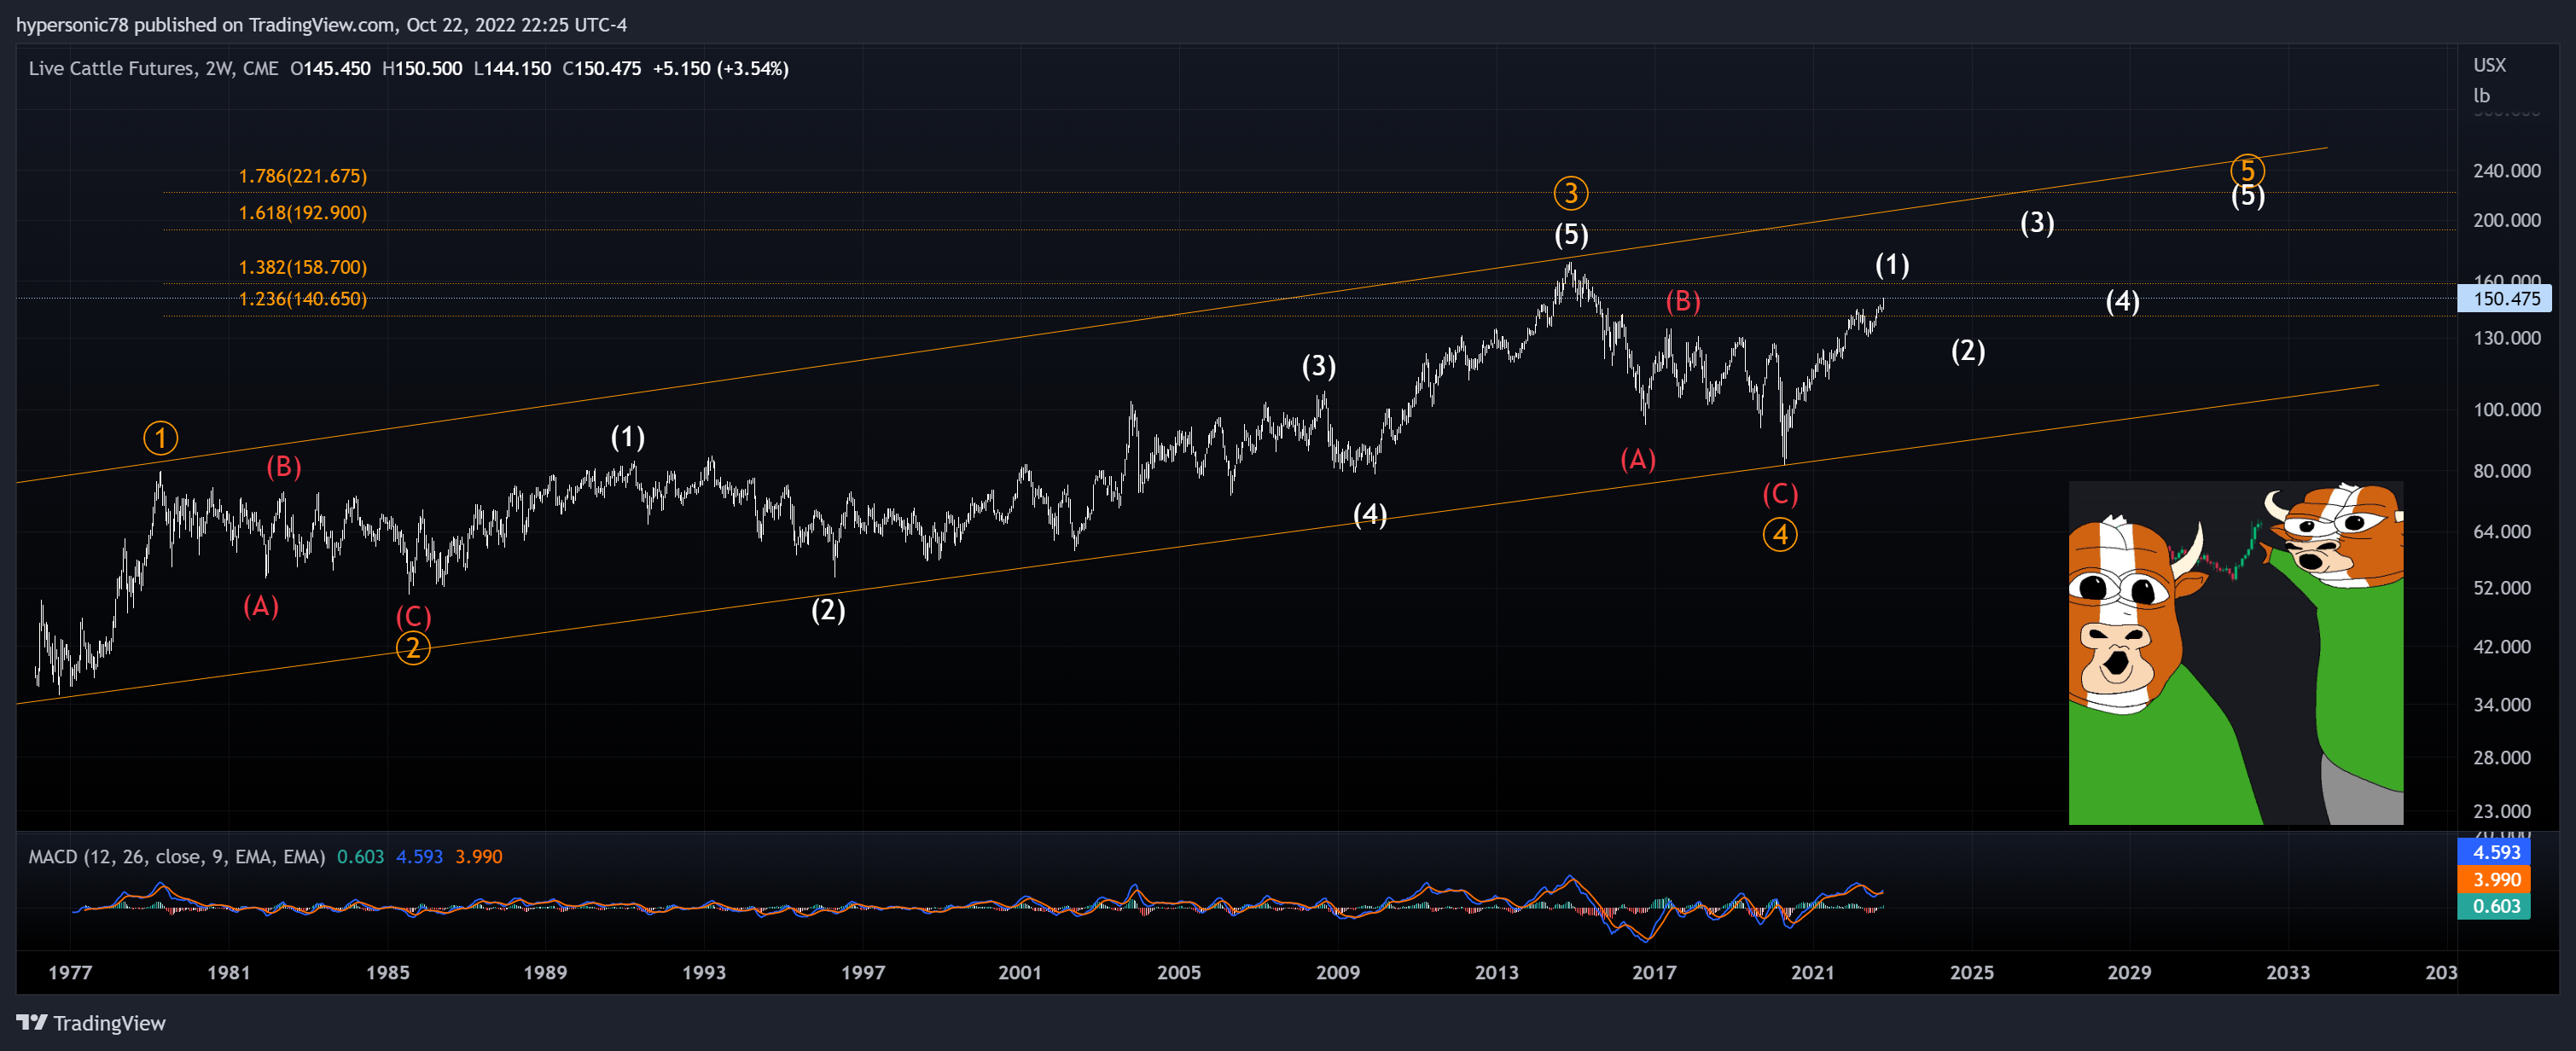
Live Cattle
Where’s the beef? Its trending higher and will continue to do so over in the longer term as its also in the process of completing 5 intermediate waves within Primary wave 5. This is not surprising given higher soy, corn, and input prices.
Lumber
Finally lets look at a non-edible agricultural commodity for completeness of the soft commodity space. This chart is different. Dare I shout “Timber”? Lumber futures made a clear blow off top in May 2021 with massive negative divergence and is now working on a larger degree consolidation (which EW cannot predict the duration of). Primary A looks to be complete but I wouldn’t be surprised to see Primary B challenge the upper trend channel before Primary C begins. This also shouldn’t surprise us after we looked at bearish charts for Homebuilders in Part 6 the Construction equipment (CAT) industry in Part 3.

Summary and Observations
All soft commodities but Lumber are in immediate bullish rising trends. Nobody can predict weather of geopolitical events which may serve as potential catalyst but we certainly know from Part 8 that costs of energy to produce these products will also be on the rise. Also remember in Part 3 that Deere (DE) didn’t have terrible looking bearish chart like many others. Please note that many of the charts we looked at in this report had overlapping wave structures making them diagonals. Diagonals can be very irregular so one must be careful trading them due to the volatility that is inherent to commodities trading. I believe these charts also add more evidence to our thesis that the upcoming economic environment will be quite stagflationary as grocery bills and restaurant tabs continue to rise.
I will post an updated Scorecard in Part 9.2 where will look at hard commodities to include major base metals. Will they follow the same trends as what we observed here?
I hope you enjoyed this report and found it as informative as I did. Please feel free to comment and ask questions as I am happy to answer then if I can.
Cheers and #EndTheFed
-Hypersonic78
https://ourworldindata.org/soy