


Surf Report 10.1: "Nuking" Energized Waves within the Uranium Sector
Uranium Explorers, Developers, Producers, and Nuclear Energy Related companies

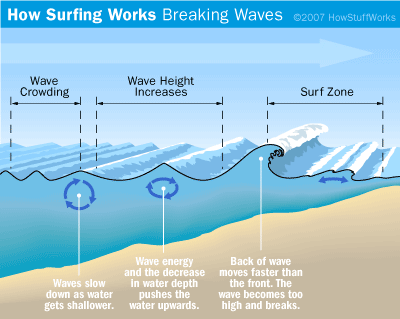
Surfers seek to harness what’s called the “energy” that’s built by the speed of the body of water moving towards the shore as well as the physical properties of the shoreline as the water depth decreases. The law of conservation of energy states the total energy of an isolated system remains constant or is said to be conserved over time. The wave’s energy from its movement gets funneled into a smaller volume as it approaches the shore and is forced to rise up. Since the water behind the wave is moving faster than the water in front, inevitably the height of the wave reaches its breaking point and the energy is released. Surfers catch this wave energy by riding the water that’s speeding up just before it breaks
Elliott’s waves also have their own energy. We’ve learned that consolidation waves such as a wave 2 or 4, or even a B wave build energy that inevitably leads to price reversals as investor sentiment reaches a breaking point. You’ve probably heard the phrase to not buy until there is “blood on street”. This saying is attributed to Baron Rothschild, an 18th-century British nobleman and member of the Rothschild banking family. The phrase encapsulates the contrarian investment strategy of buying assets when market sentiment is highly negative and prices sharply decline. The “blood in the streets” scenario is one of extreme panic and fear among market participants, leading to widespread selling and significant declines in asset prices as investors become overwhelmed by negative emotions and rush to exit their positions. Only when there is a true atmosphere of distress, turmoil, and despair will there be no more sellers left to sell. The tides are now fully out and now we have the beginnings of a reversal. Energy to the downside in a wave 2 will now be converted to the upside in a powerful wave 3.
A few weeks ago I held a quick poll to see if there was interest in revisiting the Uranium and Nuclear Energy Sector. Although the majority voted to stick with the precious metals and mining complex, a fair portion of readers were interested to see an update on this other very interesting sector which was originally reviewed in Surf Reports 7.1, 7.2, 7.3, and 7.4. Its been just over a year since we’ve looked at this sector giving lots of time for wave structures to fill out and potentially give us more probable counts. As some of you recall, many charts were a bit uncertain as to whether there would be one more Intermediate low in the sector before a major new uptrend would take hold.
Uranium can serve as a major fuel source for nuclear energy to power civilization and human endeavors forward as oil and gas production decreases or become more expensive. Many including myself are still very interested in harnessing some of that “energy” for our investment portfolios. Let’s check-in on this sector to see how the Elliot Wave energy is building.
This series will be more expanded than Surf Reports 7.1-4, and not only cover holdings within the Global X Uranium ETF (URA), but also the Sprott Uranium Miners ETF (URNM) which is more focused on companies involved with mining, exploration, development and production of uranium as well as royalty companies. This Series will also include the VanEck Uranium and Nuclear ETF (NLR) which has less holdings that URA or URNM, but includes some utility companies we may find interesting. I’ll be taking a similar approach as Endless Summer in that we will rotate through each ETF as we cover each one’s holdings which will also allow us to see which companies are more institutionally owned. We’ll begin this series by reviewing these three ETFs on their own and include two charts for commodity itself represented by Sprott Physical Uranium Trust (U.UN) and the UxC Uranium U3O8 CME continuous futures with larger degree, more long-term chart updates as well as some zoomed in 144-min charts.
Can you feel the energy? ☢️🏄︎
Global X Uranium ETF (URA)
We last did an update for URA in Surf Report 7.4 which was published nearly a year ago on October 2, 2023. Since then my view has not changed except that I think its much more likely that intermediate wave (2) has not completed just yet. Although we can count 5 waves up from the lows of 2022, we can also count an (a)(b)(c) corrective structure inside a Minor degree B wave. I’ve now made the immediate bear count which is in red/green, my primary count given the large degree of negative divergence that was seen as price rose in the first half of 2023.

Zooming into the 144-min chart we can see that price is now trying to stay above a key Fib support zone. There are hints of positive divergence forming so a (b) wave could certainly be in the cards. That next rally will be important to watch as it will give us hints on whether the alternate wave 3 of Intermediate (3) has begun or not. If the rally is highly overlapping and corrective as would be the case in a (b) wave then odds increase that the primary count for a deeper Intermediate wave (2) is in store.

Sprott Uranium Miners ETF (URNM)
The Sprott Uranium Miners Fund (URNM) seeks to invest at least 80% of its total assets in securities of the North Shore Global Uranium Mining Index (URNMX). This index is designed to track the performance of companies that devote at least 50% of their assets to the uranium mining industry. Where URA contains several engineering and construction companies engaged in the development of Nuclear energy plants, URNM focuses on the mining and resource extraction which includes exploration, development and production of uranium, or holding physical uranium, owning uranium royalties or engaging in other non-mining activities that support the uranium mining industry. URNM currently has 39 holdings and is an ETF I previously hadn’t charted in Surf Reports 7.1-4. Its wave structure looks very similar to URA with a case to be made that there may be one more potentially lower low to be seen before Intermediate (2) completes.

Zooming down to smaller degrees on the 144-min chart we again see a similar structure as URA. Friday’s low did make a low lower than the August 5th spike low and Fib support is being tested. The MACD is showing some signs of curling up so I also think URNM can get a bigger (b) wave bounce similar to URA but the same view applies that this (b) wave would be followed by a (c) of C to complete a deeper Intermediate wave (2) retracement. This would be less likely if we see a 5-wave impulsive rally above the high achieved in wave 1 in the alternative bullish count in yellow.

VanEck Uranium and Nuclear ETF (NLR)
VanEck Uranium and Nuclear ETF (NLR) seeks to replicate the performance of the MVIS Global Uranium & Nuclear Energy Index (MVNLRTR). This index is intended to track the overall performance of companies involved in: (1) uranium mining or uranium mining projects in operation or in development that are/are expected to generate at least 50% of a company's revenues or are expected to constitute at least 50% of such company's assets; (2) the construction, engineering and maintenance of nuclear power facilities and nuclear reactors; (3) the production of electricity from nuclear sources; or (4) providing equipment, technology and/or services to the nuclear power industry. NLR currently has 25 uranium related holdings and is also a new chart in this series and Substack as a whole. If we include the May 2010 spike low resulting from the May 6, 2010 flash crash, we can see a very large ABC diagonal forming, with an Intermediate (A) wave having completed in May of this year. I’ve also drawn a decade long potential cup pattern which, if valid, implies a handle is due to form. This handle can easily fill out as a corrective (B) wave. This will take a few years to fully complete this structure but we can see a that once (B) is over, a very strong upward (C) wave would begin and enable price to breakout to much higher levels to complete Primary C or even possibly a Primary wave 1.

To see how the handle of this pattern could potentially fill out we need to zoom into the 144-min chart and look at smaller wave degrees. Since A waves can present as either 3-wave or 5-wave structures, the current correction could allow for on more lower low in Minor degree wave A. If Minor A is complete and the recent pullback is a (b) wave then we should expect a 5-wave (c) wave to then take hold for Minor B. But keep in mind that B waves can also overextend so a lower low can also still count as an extended (b) wave within B. Recall how I discussed how messy B waves can be in Surf Report 7.3. Choppy waves to surf here indeed.

Sprott Physical Uranium Trust (U.UN)
I last reviewed U.UN in Surf Report 7.1. In that report I was assuming the top of Intermediate (1) was potentially complete. However support held and price broke out to complete an extended wave 5. Notice how minor wave 5 topped between the 2.618-2.786 Fibonacci extension level. Wave 5s typically top out near the 1.618-1.786 but since that extension level proved to only be the top of wave 3, wave 5 was able to extend upwards to the 2.618-2.786 which is also typical. But now that we’ve seen a much fuller 5 waves with a cleaner structure, I do now think it is more probable to expect a larger degree pullback in the form of an Intermediate (2) which likely began in May. However that is not to say that price will keep continuing immediately lower. On the 3-day chart we are seeing the MACD beginning to curl upward.

Then when we zoom in on the 144-minute chart, we see positive divergence as price has declined in Minor degree wave A. While A can certainly extend a little lower, we should expect a B wave bounce next at some point after A completes. We can set wave targets for that B wave based on the structure that begins to form after a bottom is struck in Minor A. Remember that B waves can be messy and uncertain. They are certainly surfable but one must always keep in mind that a C wave is coming next.

UxC Uranium U3O8 CME
The UxX Uranium U3O8 futures contract is for 250 lbs of Uranium U3O8 based on month-end spot price published in Ux Weekly for the contract month by UxC, LLC. I don’t recall seeing this data set available in TradingView when I was preparing Surf Report 7.1, but since it is now available we might as well track it. Unlike the Sprott Physical Uranium Trust, the initiation of the larger degree bull market in this futures contract began in late 2016. From there we can see a full 5 waves up in the Intermediate degree with smaller degrees presenting as three wave diagonals. If this interpretation is correct, then we should now be seeing a Primary wave 2 correction unfolding where price may consolidate for some time. This is not to say that Uranium spot prices will “collapse” but are due for a healthy pullback. Primary wave 2 does not need to retrace as deep as I’ve shown but we do want to see an Intermediate corrective structure complete

Summary
What a difference a years worth of price structure can make to add clarity to the Elliott wave counts we are observing in the Uranium and Nuclear Energy sector. The energy is building in the sector but it appears that there is currently a higher probability of a deeper retracement and consolidation occurring first before the sector becomes fully energized for a larger degree bull move. Everything we reviewed in this report looks due for a bounce but it will be the nature of that rally that will help us determine whether there will be one more important low in the sector before it turns up into a longer term sustained uptrend. But of course these ETF and commodity charts are a representative sample for the sector. My intention is to “nuke” this sector by being extremely thorough and review all individual holdings within these three ETFs. It will take some time for us to go through. As we continue to review the precious metals and mining sector in the Endless Summer series, we will interleave this series of Surf Reports on the Uranium Mining and Nuclear Energy sector to regularly check in and see if we have indications of a meaningful bottom and reversal.
Thank you for reading and subscribing and I hope you enjoyed this report! We’ll return to Endless Summer with Surf Reports 9.2-3 (GDX holdings) and 9.3-3 (SIL holdings) before we begin with 10.2-1 which will cover the first set of holdings in URA.
Until then…
Cheers and #EndTheFed!
-Hypersonic78
Disclaimer: None of this is financial advice! Please do your own diligence. The views expressed here and other Surf Reports are my own. Only risk what you can afford to lose in these crazy markets. Know your timeframes, parameters, and personal risk tolerance.
As always please remember that Elliott Waves cannot predict timing and predictive counts that are shown on the charts based on historical and probabilistic price structure are notional.
Position Disclosure: I currently have no positions in any of the ETFs or futures contracts reviewed in this report but am interested in building a a position at some point in the future.
Nice article, and pretty close on the surf physics! The waves do indeed peak up to conserve energy, since they slow down as they enters shallower water and convert that to potential energy, i.e. height. But the primary reason why waves break is because, at some point, the speed of the very top of the wave exceeds that of the water below it, and it pitches over and breaks. The water behind going faster than the water in front is something I haven't heard this process described as before, and it is a bit more accurate to say that water molecules in an unbroken wave are moving in a circular or elliptical path until the wave breaks. Nonetheless, I enjoyed the read and the metaphor!
We must have a bit of ESP going on! I was just looking at the Uranium chart, thinking, it must be close to a turn. Great timing, and thanks for the longer term charts. Cheers.