


Surf Report 7.4: URA is "Explosive"
Uranium Miners and Related Companies in URA, Part 4

Now that we’ve finished looking at the Oil and Gas sector for the time being we need to turn our attention back to the Uranium sector which has also been in a strong rally mode over the past couple months. In Surf Report 7.3 I warned y’all about B waves. The biggest question I am asking, as are others who may be looking at this sector, is that if the rallies we’ve seen in Uranium and related sector shares are in a larger B wave with one more low ahead or is this the beginning of a larger degree bullish wave. Or perhaps something else like a higher wave 5 inside Intermediate (1). We need to take a close look. Each chart on its own. So far in Surf Reports 7.1, 7.2, and 7.3 we’ve covered 27 of the 46 total weighted holding of the Global X Uranium (URA) ETF. We have 19 left which I will split between this report and 7.5. I will also update all previous charts and link them to TradingView captures with relevant notes as I’ve done before. Its going to be a lot to go through but I feel its a solid strategy to get feeling for what the waves are doing in the Uranium sector. We’ll revisit the URA ETF first.
Global X Uranium ETF, URA (Update)
URA really surprised me when it broke out of the flag a couple back in June. We’ve seen false breakouts in precious metals before and since the wave structure was quite overlapping in wave (i), caution was warranted. Price is making really good progress toward making a full 5 waves up in the Minuette degree in orange. Completing that 5 wave structure would would help confirm at the Intermediate wave (2) is likely complete. If we see price impulsively break down from below Fib support then we would need to consider the alternate count with a lower (2) or perhaps a flat back to around $18.

CGN Mining, 1164.HK
CGN Mining Company engages in the development and trading of natural uranium resources to nuclear power plants. The company is also involved in the property investment and leasing activities with operations in the United States, the People's Republic of China, Canada, the United Kingdom, and rest of Europe. Similar to URA we may still have a B wave on our hands. A completed 5 wave structure will validate that Intermediate (3) has indeed begun otherwise a C wave can be expected. Surf carefully.

Ur-Energy Inc, URG
Ur-Energy Inc. is an American mining and exploration company which engages in the acquisition, exploration, development, and operation of uranium mineral properties. The company holds interests in 12 projects located in the United States. Its flagship property is the Lost Creek project comprising a total of approximately 1,800 unpatented mining claims and three Wyoming located in the Great Divide Basin, Wyoming. Here I believe we have a better chance at confirming an Intermediate wave (2) low with more of a complete downward structure. Again looking at the 144 min chart we need to see a full 5 up (which wave (v) of 1 is underway) and corrective 3 waves within Minor degree 2.

American Lithium Corp, LI.V
You are probably wondering why a Lithium resource developer is in a Uranium ETF aren’t you? Because not only does American Lithium have its eye on developing Lithium resources at the TLC Lithium near Tonopah, Nevada and the Falchani project in Puno, Pero, but the company also is investing in the the Macusani Uranium project which is also located located in Puno. Macusani is a proposed low cost (US$17/lb) mine that may produce an average of over ~6 Mlbs U3O8 per year1. Ok this one grabbed my attention. We have some potential here for some pretty astounding Primary degree Fib extensions on LI provided a low can be found within the assumed bottom channel as shown. We’ll have to wait and see how this fills out. Looking at the 144 min chart there may be just a little more downside within (C) before Primary 3 begins. I’m personally looking at this one very closely for signs of a bottom.

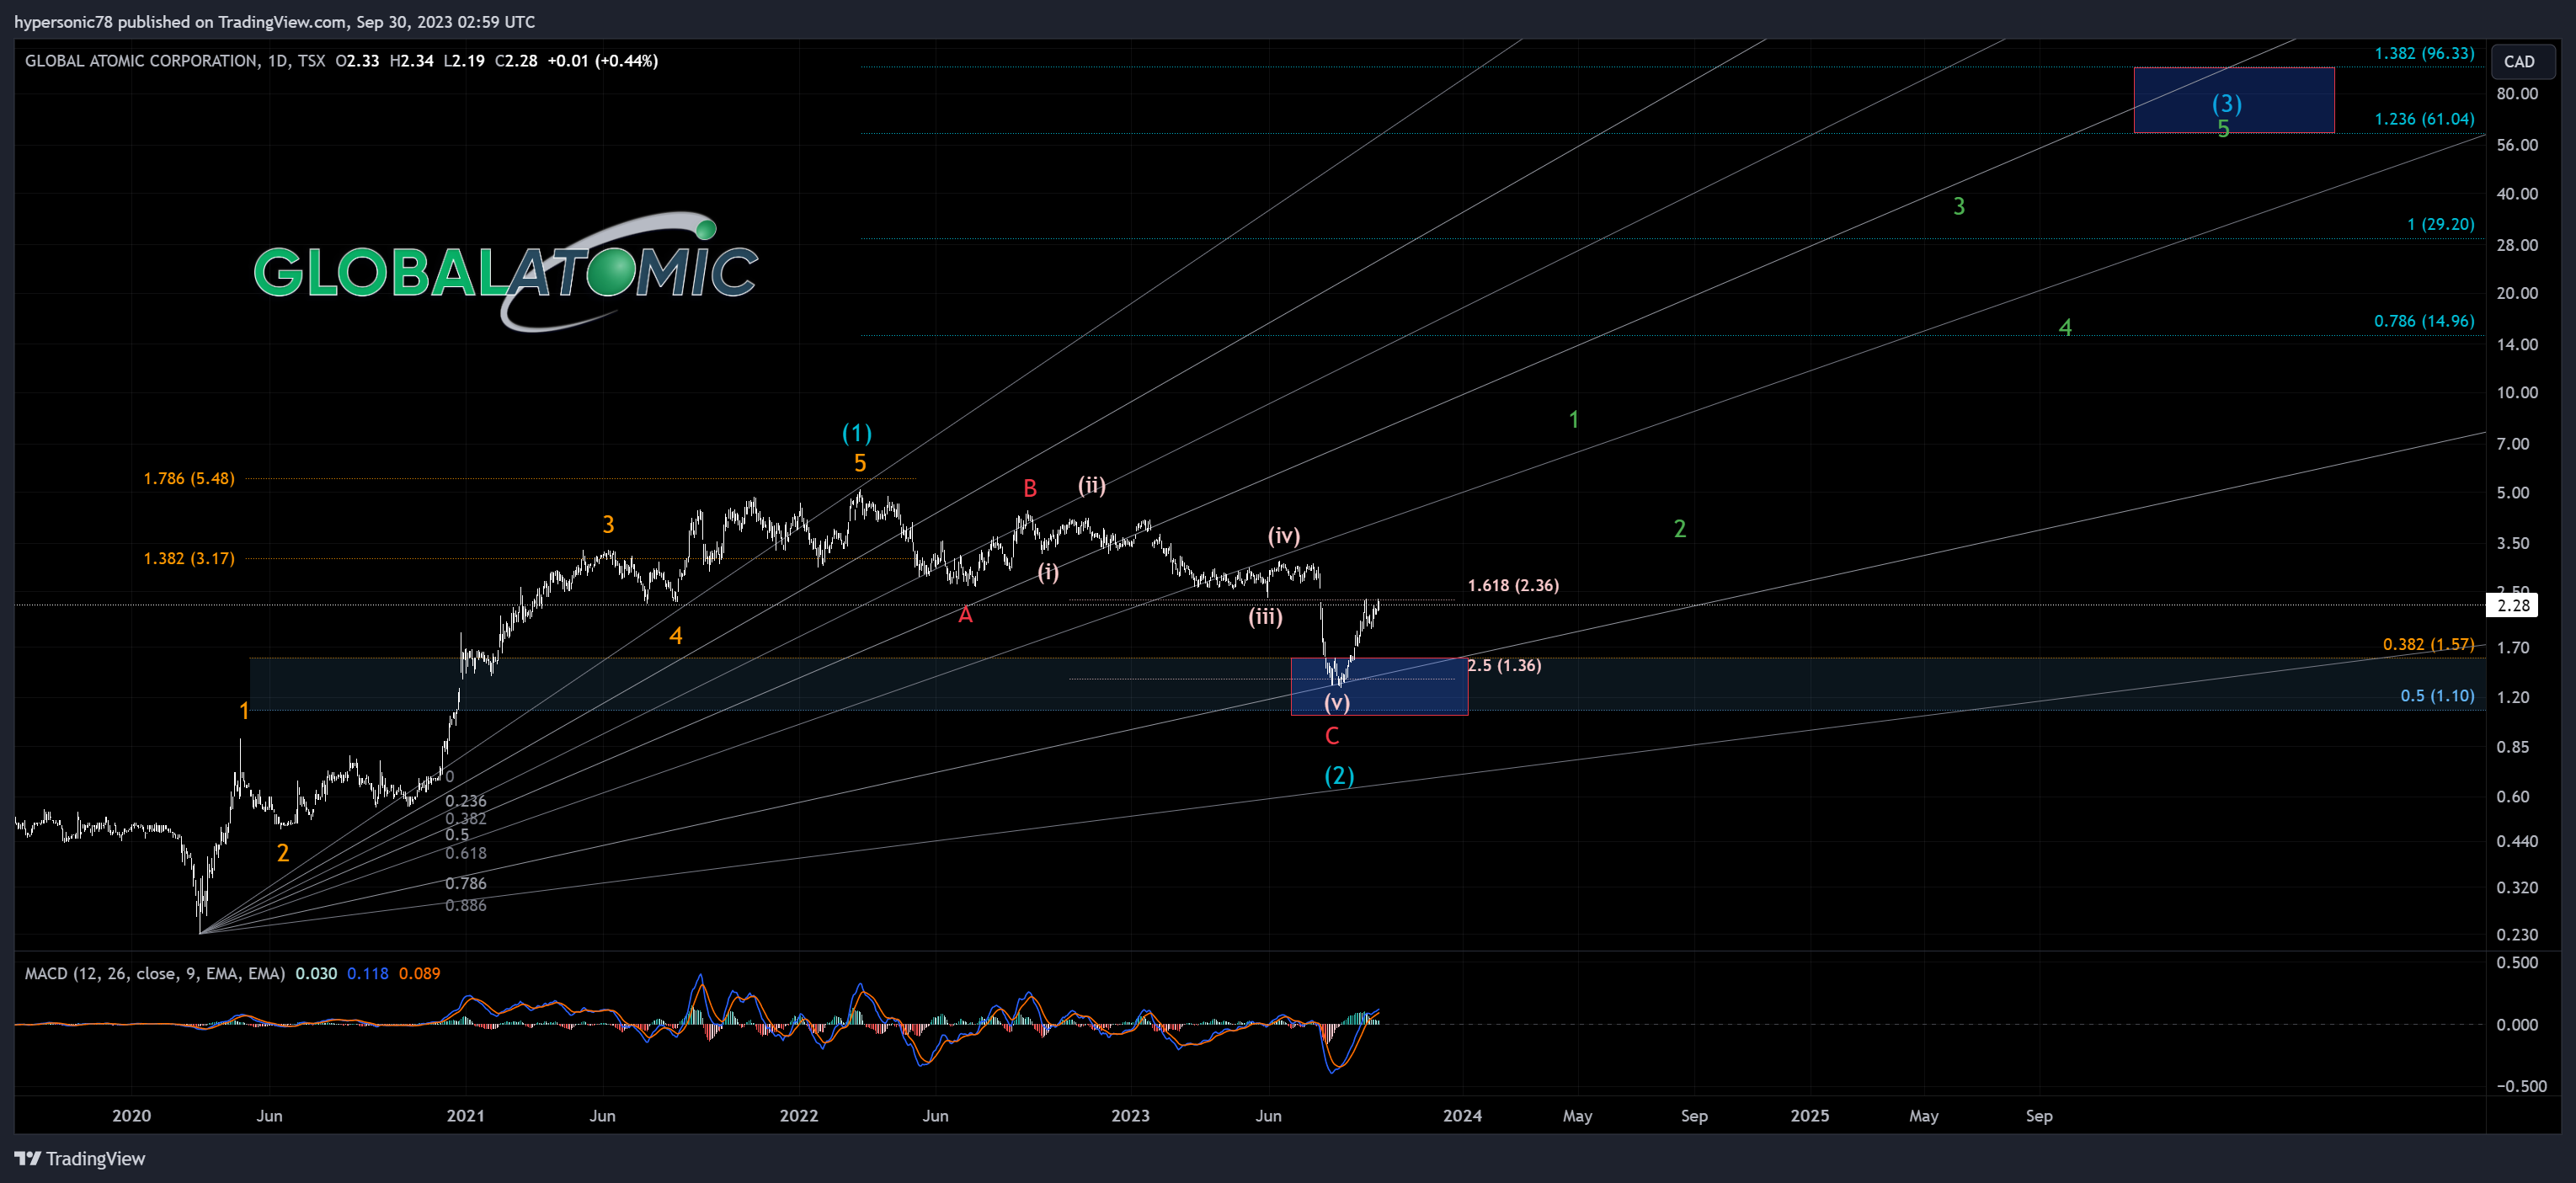
Global Atomic Corp, GLO.V
Global Atomic Corporation is an Canadian company that engages in the acquisition, exploration, and development of uranium properties in Niger. The company owns 100% interest in the Dasa deposit located in the Republic of Niger. It also processes electric arc furnace dust into zinc concentrates. Here I see both a clear 5 waves up from the 2020 low to complete Intermediate (1) and filled out Intermediate (2) corrective ABC structure. Very nice Fib extensions here for Intermediate targets! Surf’s up.
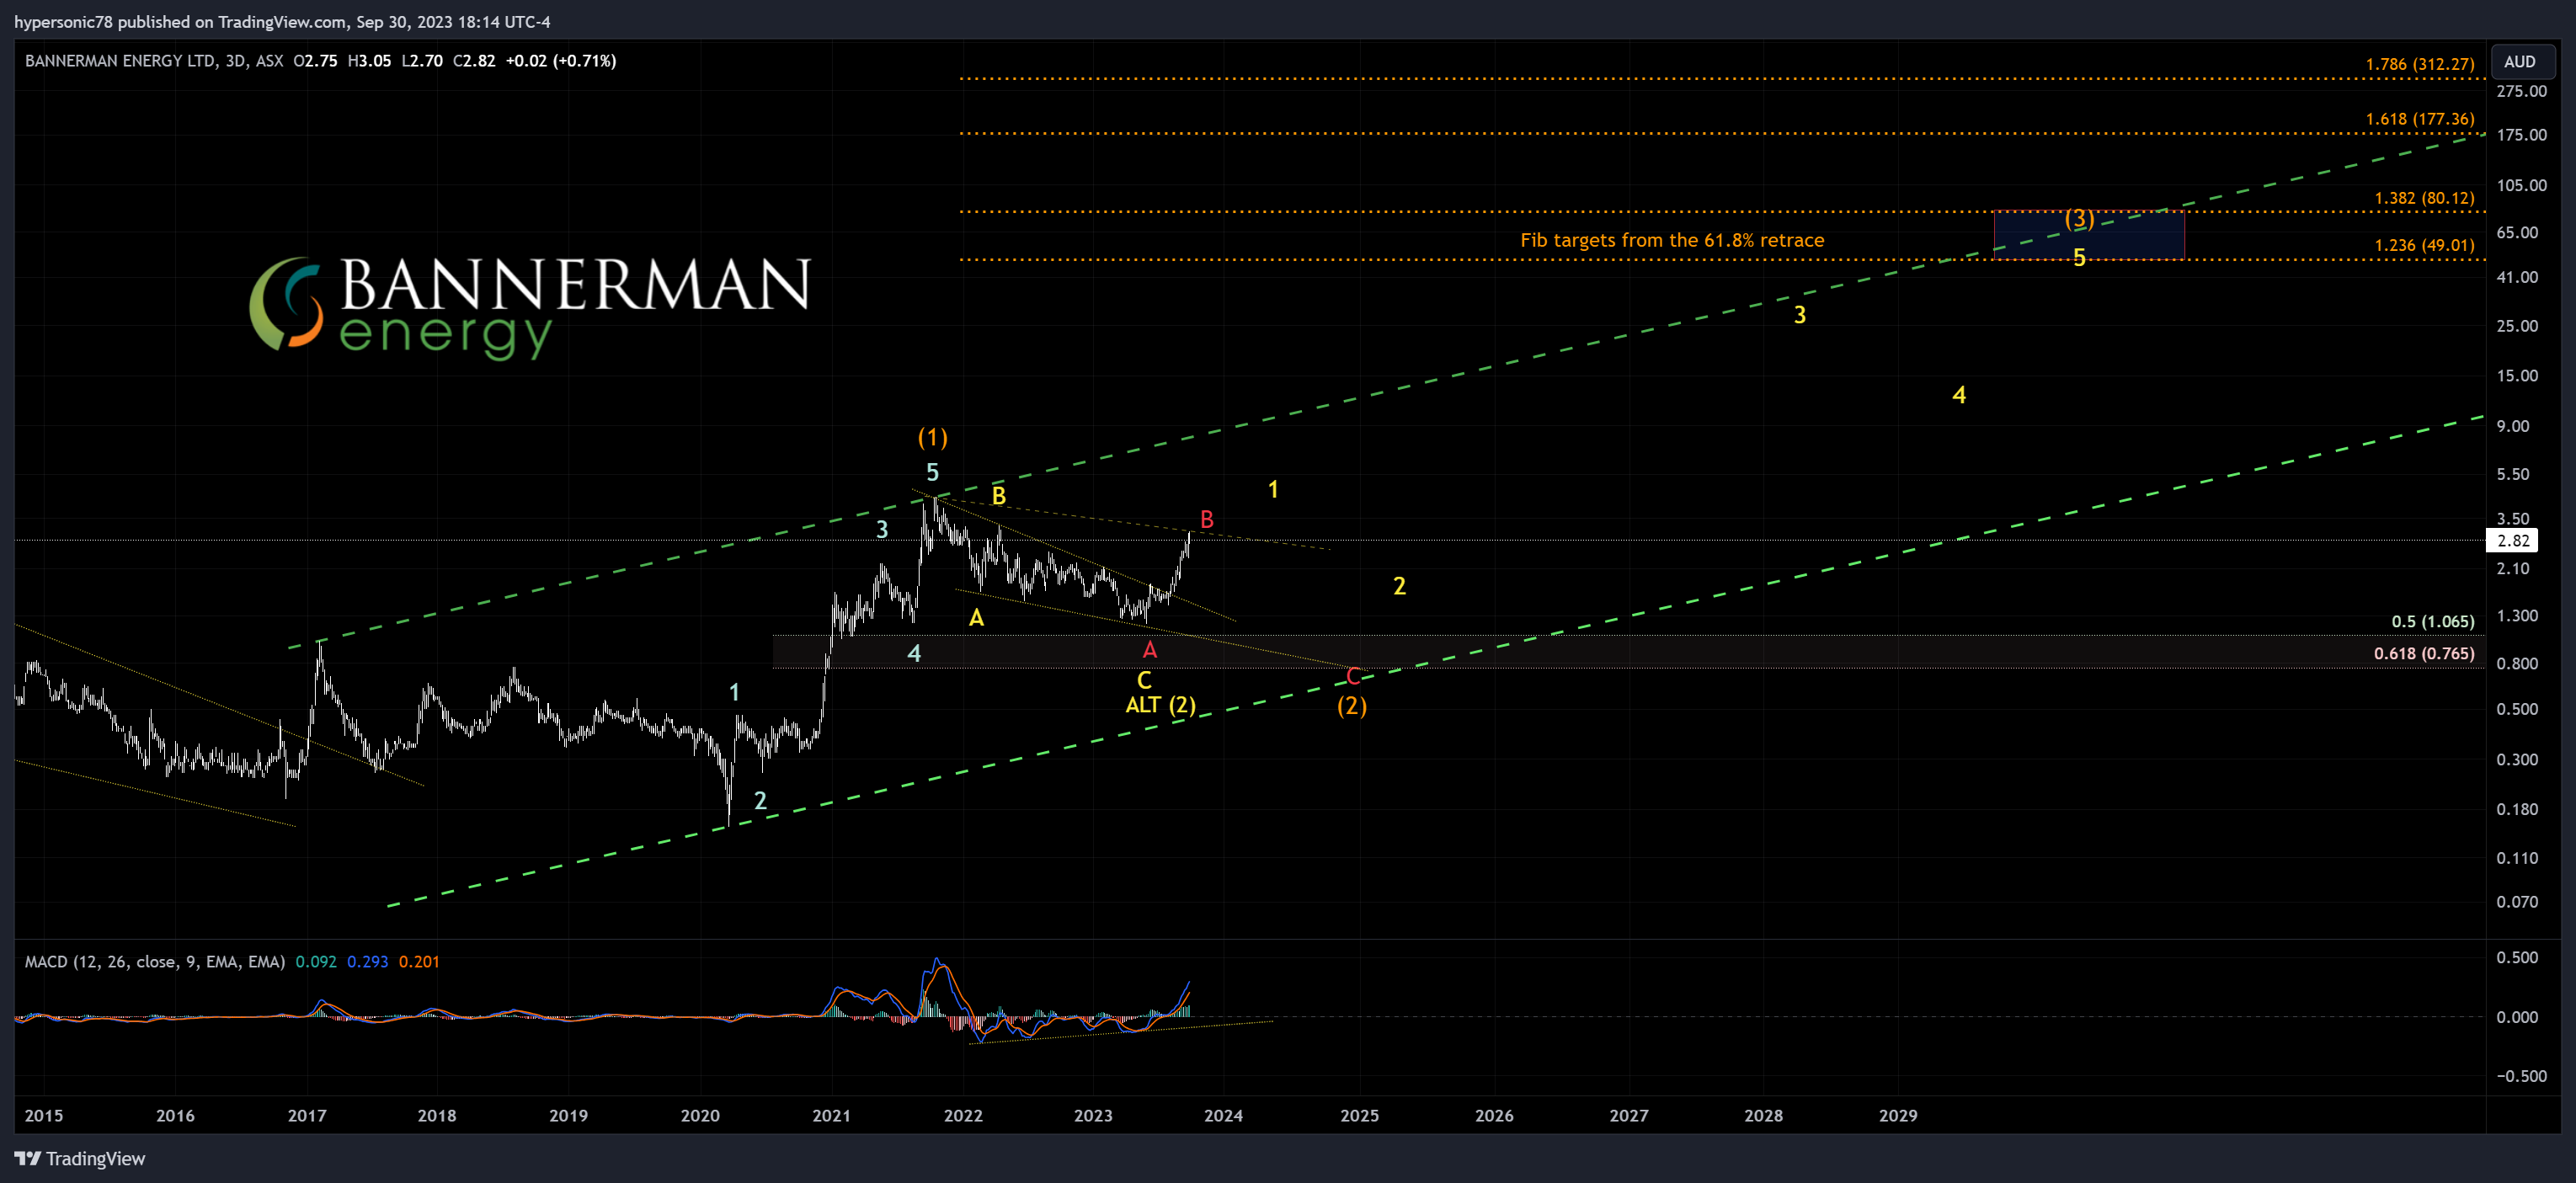
Bannerman Energy Ltd, BMN.AX
Bannerman Energy is an Australian listed uranium development company whose flagship Etango Project in Nambia is one of the world’s largest undeveloped uranium resources. BMN also had a clean 5 up off the 2020 lows but here I still question whether it as completed all of Intermediate (2). A full 5 up as shown in the 144 min chart will help confirm that the lows are in and the potential for much higher levels to be seen in the Intermediate degree.
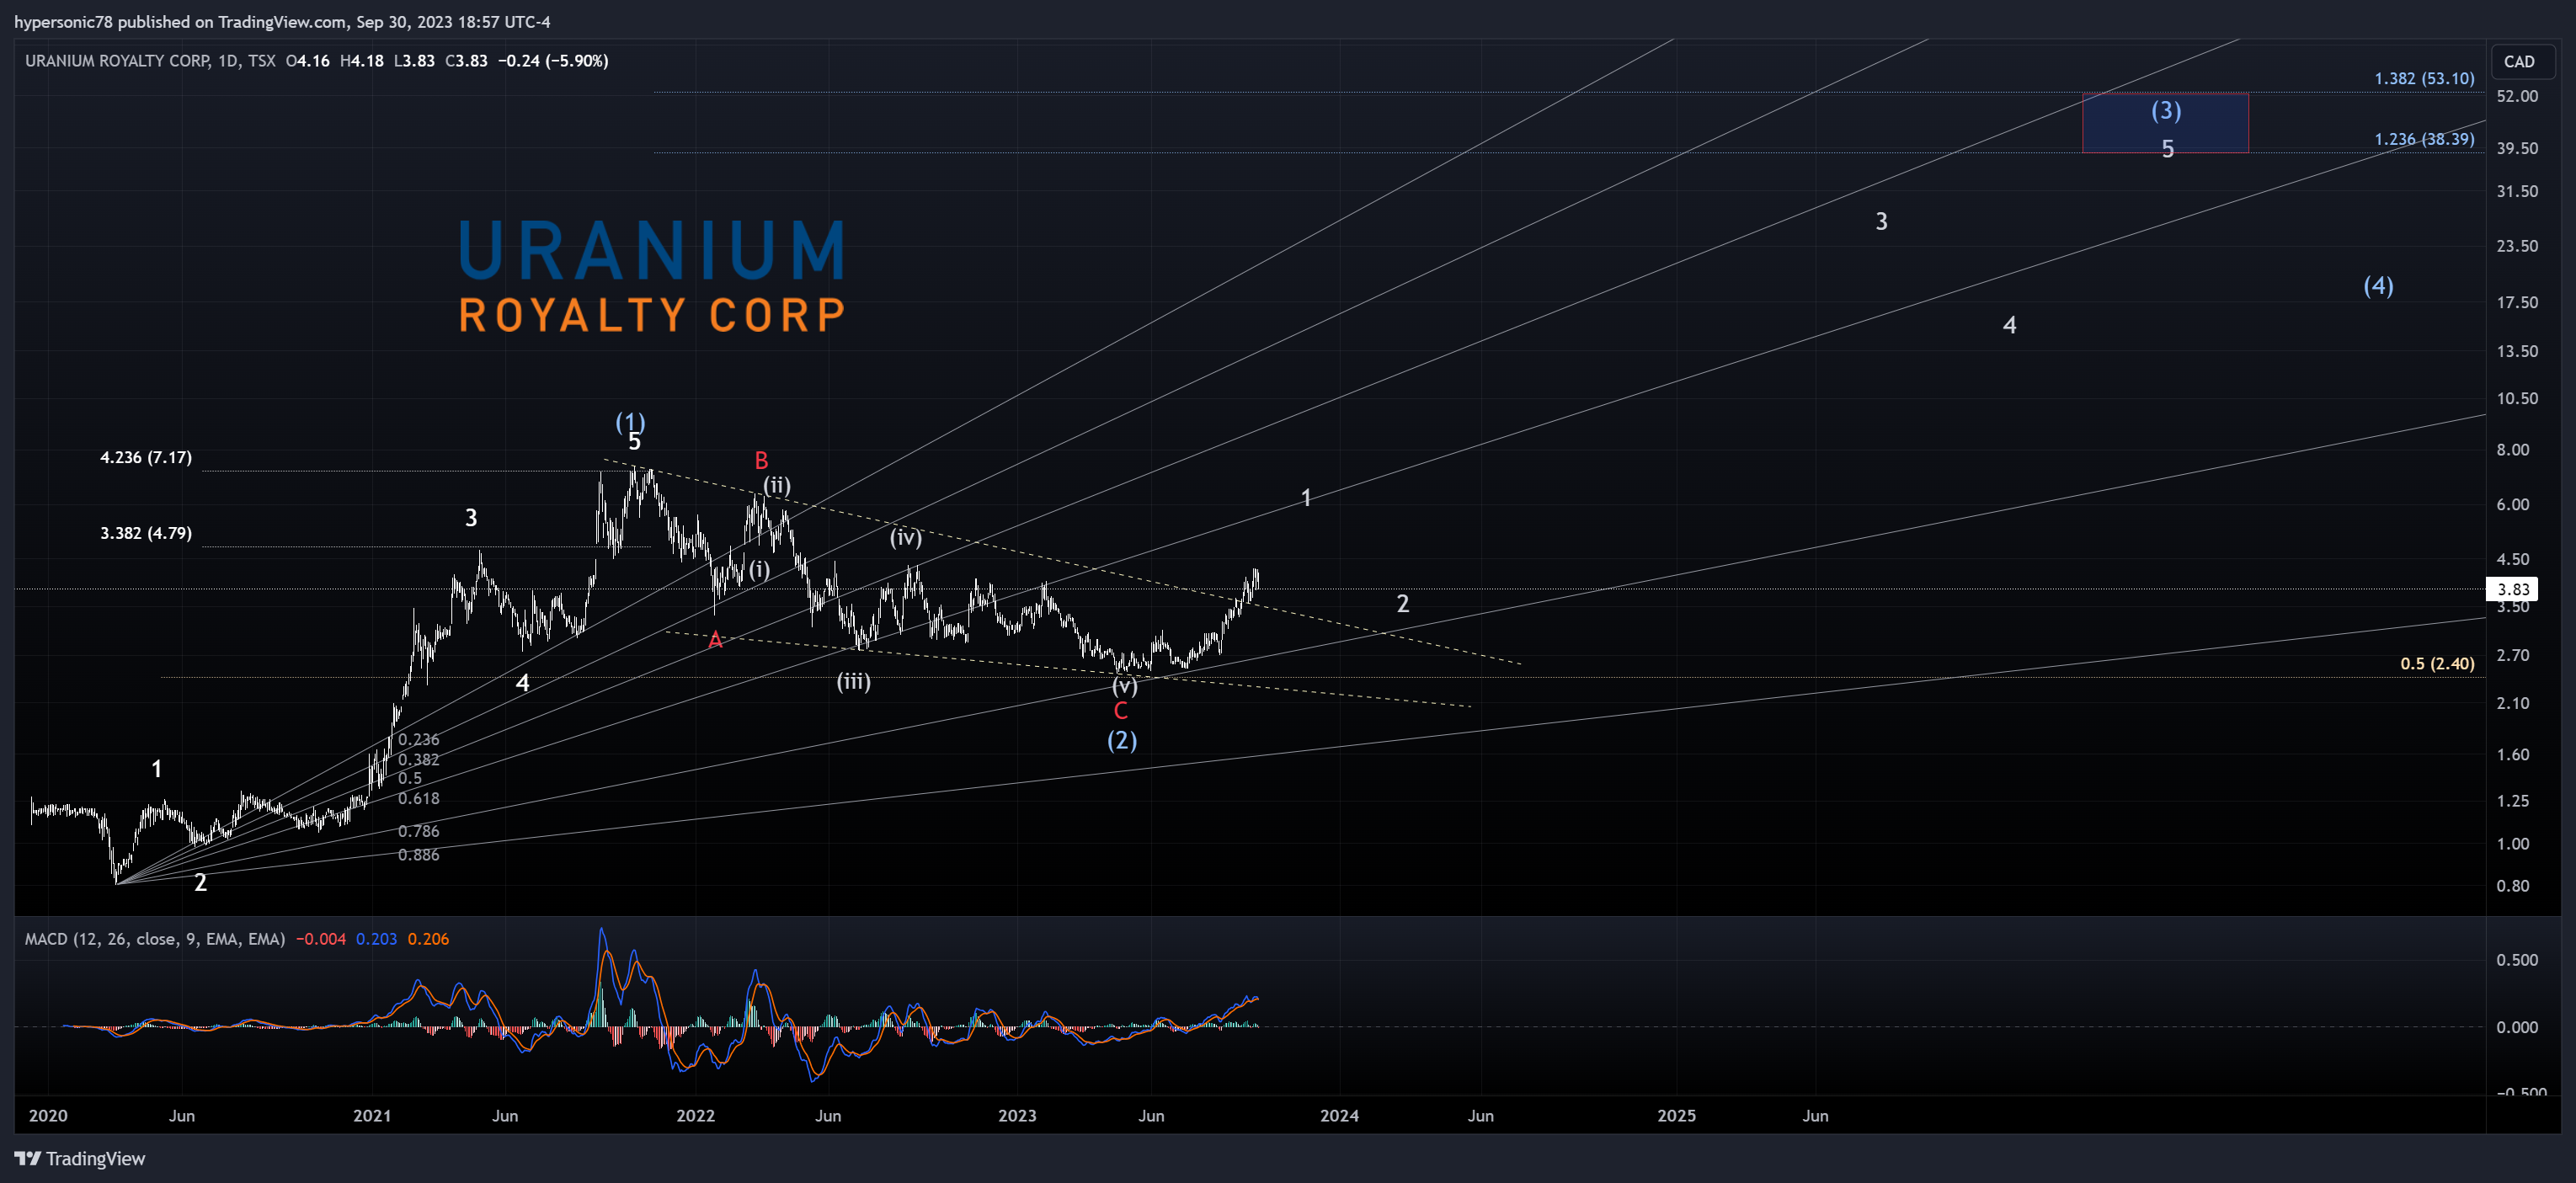
Uranium Royalty Corp, URC.TO
Uranium Royalty Corp. operates as a pure-play uranium royalty company. It acquires, accumulates, and manages a portfolio of geographically diversified uranium interests and has royalty interests across Canada (Saskatchewan, Newfoundland and Labrador), the US (Arizona, Wyoming, New Mexico, South Dakota, Colorado, and Utah), and Nambia. Again a very extended 5 up from the 2020 lows for an Intermediate (1). So long a full 5 waves up are achieved from the April 2023 lows as shown in the 144 min chart then Intermediate (3) is likely under way. Another wave worth watching based on potential Intermediate Fib extensions.
Lotus Resources Ltd, LOT.AX
Lotus Resources Limited is an Australian firm which owns an 85% interest in the Kayelekera Uranium Project in Malawi, Africa. Kayelekera is currently on care and maintenance and is past producing asset having delivered approximately 11 million pounds uranium, before its closure due to a sustained low uranium price. Lotus recently announce a merger with A-Cap Energy which has the Letlhakane Uranium Project in Botswana. After a full 5 waves up from March 2020, I am questioning whether the Intermediate wave (2) lows are in as there is only 3 waves up from the March 2023 lows as shown in the 144 min chart. Be careful with those B waves. I’ve shown Intermediate Fib extensions from the 38.2% retrace level but those could stretch higher if (2) is confirmed.

IsoEnergy Ltd, ISO.V
IsoEnergy Ltd. is a uranium exploration and development company with a portfolio of prospective projects that sit in the Athabasca Basin in Saskatchewan, Canada. NexGen Energy is a major supporter and shareholder. The company recently announced a merger with Consolidated Uranium. ISO could also be in filling out a larger B wave but again we’ll need to consider that Intermediate (3) has begun if a full 5 waves up can complete followed by a corrective pullback as shown in the 144 min chart. I’m noticing a trend here don’t you?

F3 Uranium Corp, FUU.V
F3 Uranium Corp. is a Canadian uranium project generator and exploration company, focusing on projects in the Athabasca Basin in Canada. F3 Uranium currently has 16 projects in the Athabasca Basin. I’m viewing both (1) and (2) as being complete as a diagonal which may imply a fuller diagonal in the Intermediate structure based on the Fib extensions. We would then expect 5 waves within (C) of (3)

Alligator Energy Corp, AGE.AX
Alligator Energy Limited is an Australian mineral exploration company with activities in Australia and Italy. It primarily explores for uranium, nickel, cobalt, copper, and other energy mineral deposits. The company holds 100% interests in the Samphire Uranium project and Big Lake Uranium project situated in South Australia. It also holds interests in the Alligator Rivers Uranium Province located in the Northern Territory; and Piedmont project located in Northern Italy. The trading volume data was really thin after the 2020 low was achieved so there is an assumption that the initlay impulse was an Intermediate (1) followed by a multi-month corrective (2). One could also assume a larger diagonal as we saw for F3 Uranium with an ABC for a larger (1) topping in September 2021 where I have (3) noted. This would lead to much higher extensions in the intermediate degree. For now I’m assuming a more conservative view that this is beginning a wave (5) which also needs confirmation with a completed 5 up / 3 corrective down as shown in the 144 min chart.

Summary
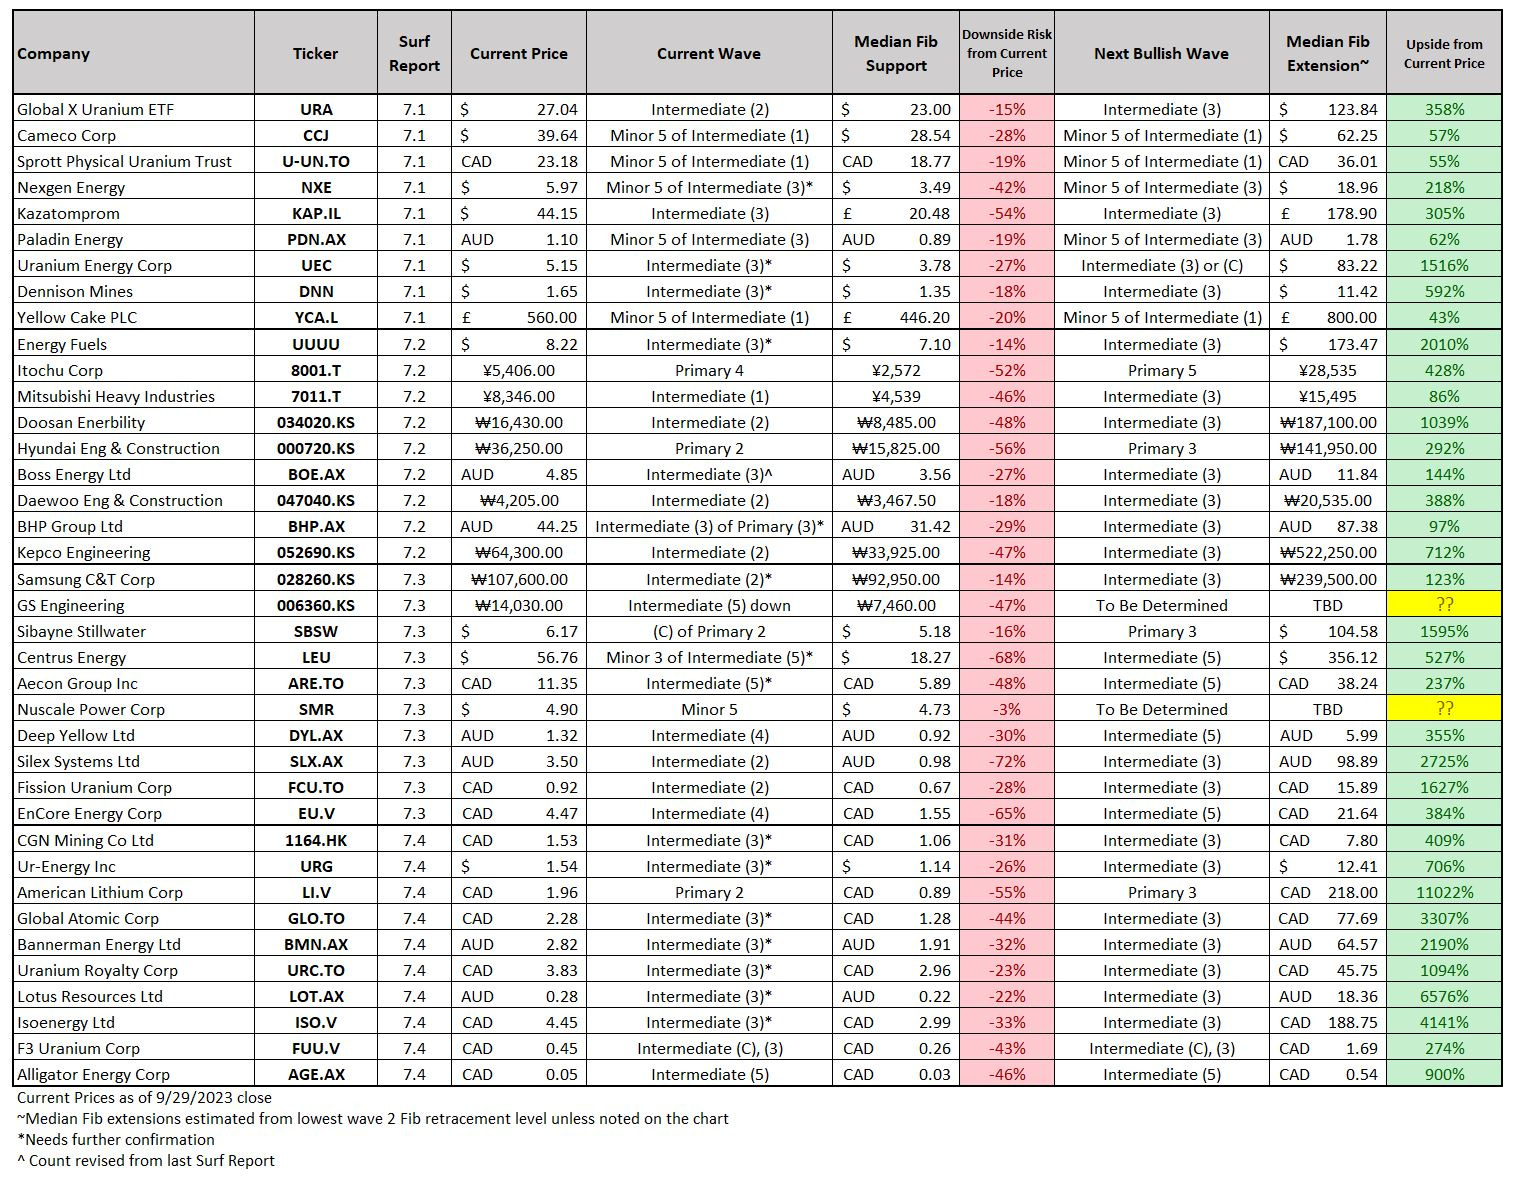
The recent rally in Uranium and related sector shares has taken many including myself by surprise this year. Elliott’s waves warned of potential lower lows but are now telling us that the lows may already be in. Now we can look for lower risk entries to surf. Many congratulations to those who held on and are seeing some nice gains in recent months! Many names are in the process of completing 5 wave structures off the lows struck earlier this year. Below is a summary table for the collection of URA holdings that we’ve reviewed in this Surf Report as well as Surf Reports 7.1-3. I’ve updated support levels we would not want to see broken for bullish outlooks to remain intact. Note that some higher upside price targets listed are in larger degree extensions (Primary vs Intermediate) so its not exactly apples to apples. Timeframes are important.
For completeness, I’ve updated and linked the charts below that we’ve previously analyzed and added notes to each chart to describe current wave structures and validation points. This list is getting long! Surf Report 7.5 which I hope to be published in a few weeks will then have updates to this set and what we just covered here so it will contain the complete picture for URA. I may need an extra cup of coffee for preparing that one! 😂
As I said before, we’ll have the 5th and final part of this series to finish “nuking” the URA in a few weeks. In the meantime, the next Surf Report will focus back on homebuilders with the XHB ETF. The US 10-year Treasury has been on a tear lately and by extension 30 year mortgage rates. Sales volumes also continue to plunge and housing inventory is ticking up which is abnormal given the time of the season. I think its a great time to check in on those Homebuilders don’t you?!
Until the next Surf Report…
Cheers and #EndTheFed
-Hypersonic78
Disclaimer: None of this is financial advice! Please do your own diligence. The views expressed here and other Surf Reports are my own. Only risk what you can afford to lose in these crazy markets. Know your timeframes, parameters, and risk tolerance.
Position Disclosure: After charting American Lithium, I initiated a small long term starter position which I intend to add to on price weakness. This chart and a few other Lithium miner charts has me quite interested in the Battery Metals sector and I intend to take a closer look at the Sprott Lithium Miners ETF, (LITP) in a future Surf Report Series so please standby for that. I also hold a core long term position in SBSW that I’ve been adding to. I personally am not chasing any other names in URA but will wait for the full 5 waves up to complete and revisit wave 2s for possible lower risk positions.
_____________________________
These reports take a lot of time / effort. If you enjoy them, coffee or KAG are greatly appreciated if you wish…
Coffee: Ko-fi.com/hypersonic78
Kinesis KAU/KAG: GAO2JIBCQFAEOPHJPGEIAKIANOJ5ZMBSGARLGLY5PRNJGKD64W3OZZNC
https://americanlithiumcorp.com/macusani-uranium-project/
I own some American Lithium - both for the Li and U exposure. On the daily there is quite a strong bullish divergence. I think we will have a bounce in the coming days but remains to be seen how high it goes. Long term I like the prognosis. If this truly does go to $260 I'll be able to retire early, or at the very least maybe avoid going on Govt food stamps. :)
Great work, congratulations again!